Fig. 14
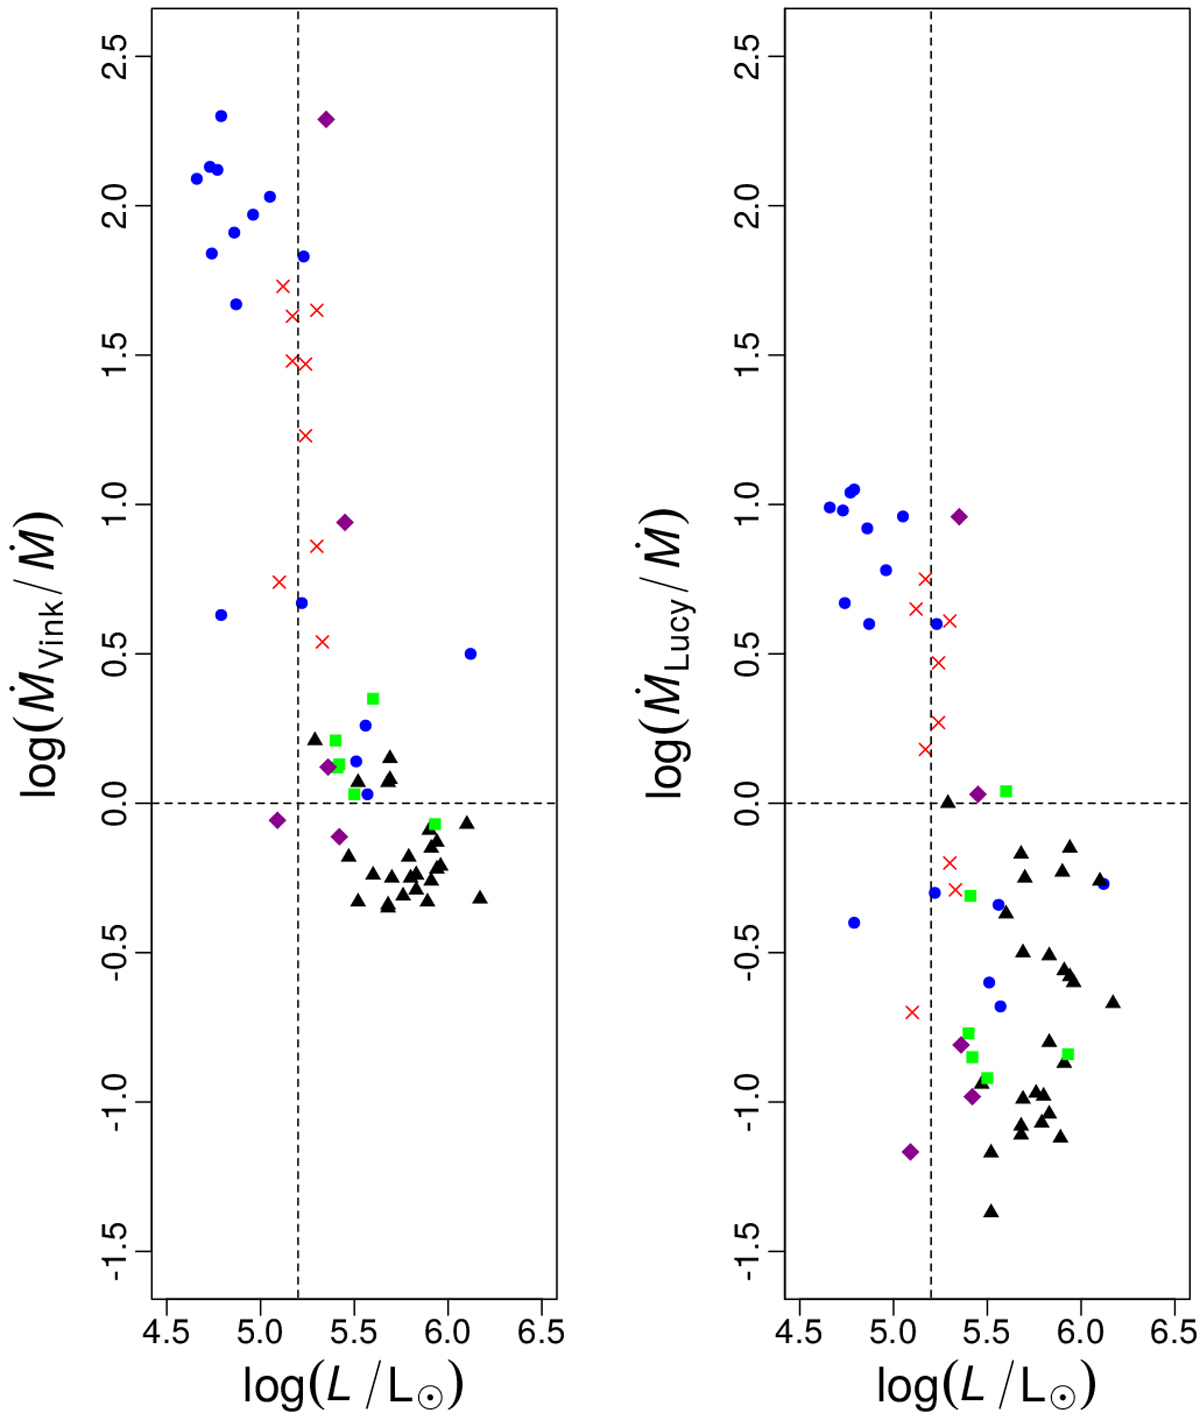
Difference (as a function of luminosity) between the measured Ṁ (clumped) and their theoretical values by Vink et al. (2000) on the left, and by Lucy (2010a) on the right. Symbols stand as presented in Fig. 8, our results are shown in red crosses. The luminosity value of log (L⋆ ∕L⊙) = 5.2 and the match between the spectroscopic and theoretical Ṁ are indicated by dashed black lines. We note that ṀLucy attenuates the weak wind problem, but it increases the discrepancy to the spectroscopic Ṁ in log (L⋆ ∕ L⊙) ≳ 5.2.
Current usage metrics show cumulative count of Article Views (full-text article views including HTML views, PDF and ePub downloads, according to the available data) and Abstracts Views on Vision4Press platform.
Data correspond to usage on the plateform after 2015. The current usage metrics is available 48-96 hours after online publication and is updated daily on week days.
Initial download of the metrics may take a while.