Fig. 7.
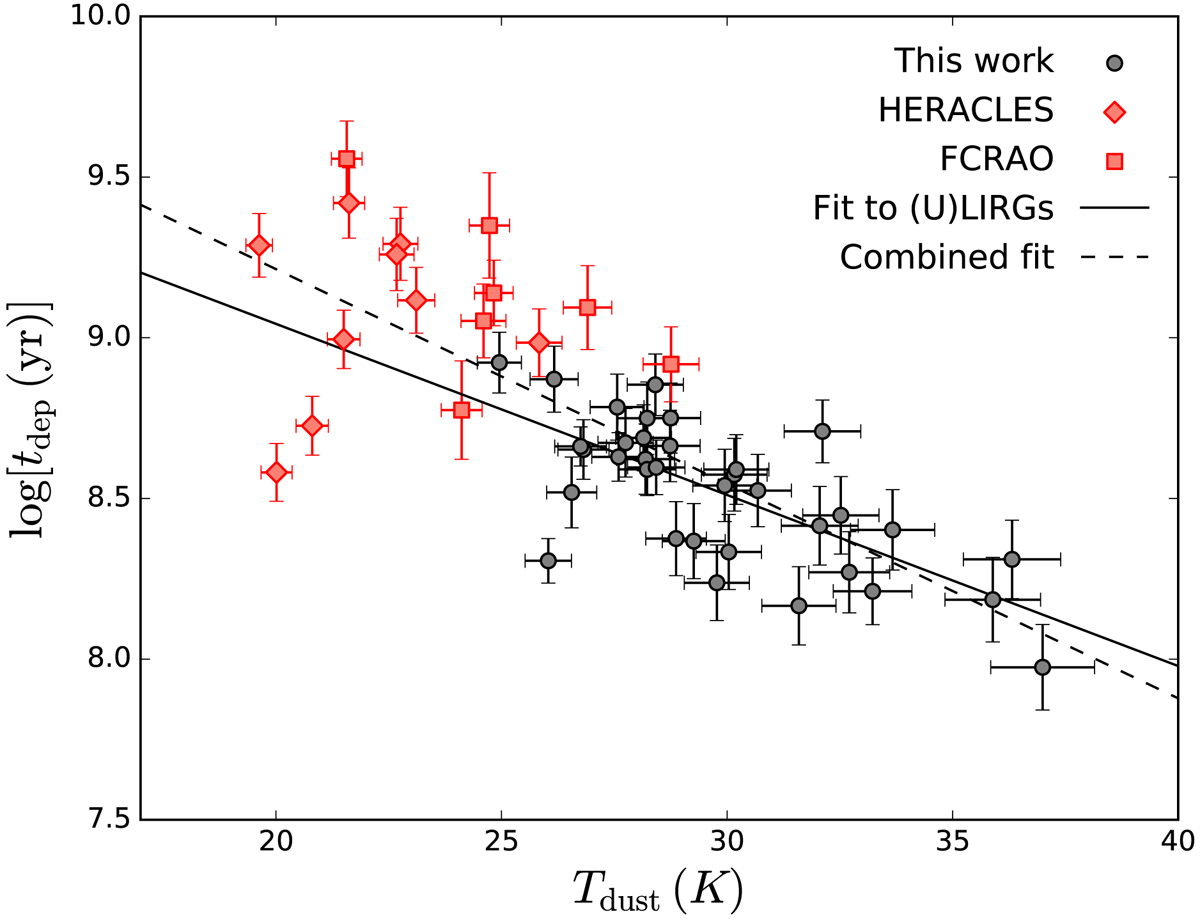
Depletion time versus dust temperature, using Tdust fitted values to obtain Mdust. Dust tmeperature is obtained from the SED model fit. The solid line represents the linear fit for the (U)LIRGs, yielding log(tdep)=(−5.5 ± 1.0)×10−2 Tdust + (10.1 ± 0.3). The dash lines represent the best fit considering also our local comparison sample; the fit yields log(tdep)=(−6.9 ± 0.8)×10−2 Tdust + (10.6 ± 0.2),
Current usage metrics show cumulative count of Article Views (full-text article views including HTML views, PDF and ePub downloads, according to the available data) and Abstracts Views on Vision4Press platform.
Data correspond to usage on the plateform after 2015. The current usage metrics is available 48-96 hours after online publication and is updated daily on week days.
Initial download of the metrics may take a while.