Fig. 6.
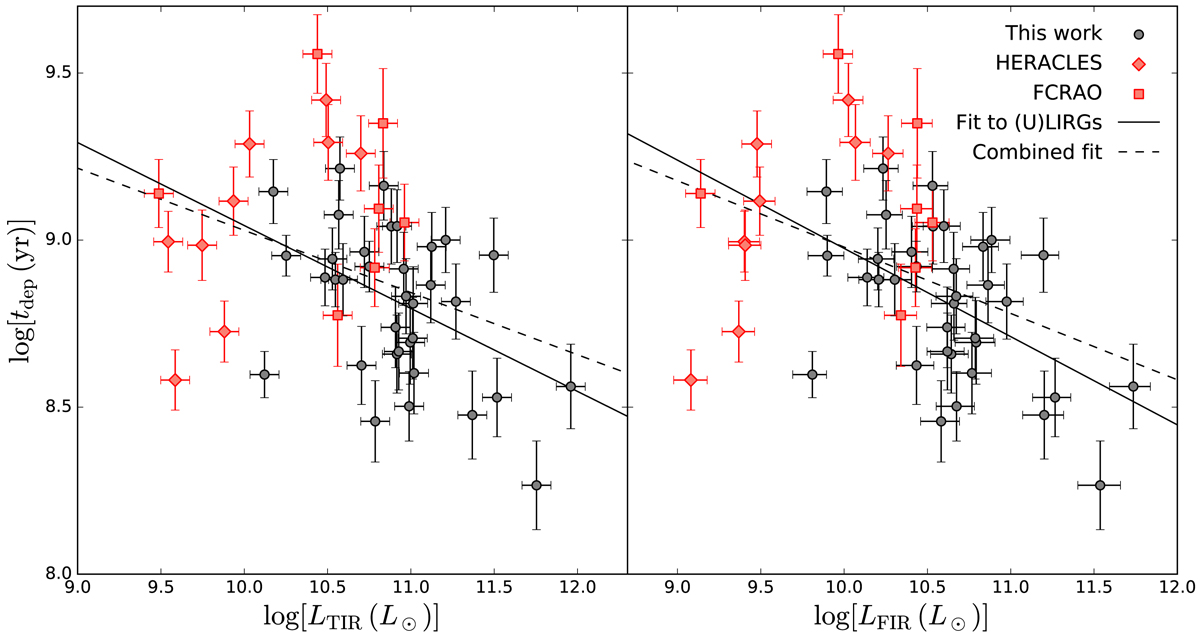
Depletion time as a function of TIR and FIR luminosities. Solid lines are fits to the (U)LIRG sample, where log(tdep) = (−0.25 ± 0.10)log(LTIR)+(11.54 ± 1.05) and log(tdep) = (−0.26 ± 0.09)log(LFIR)+(11.61 ± 0.96). Dashed lines are a fit to the combined sample and yield log(tdep) = (−0.19 ± 0.07)log(LTIR)+(10.89 ± 0.77) and log(tdep) = (−0.20 ± 0.06)log(LFIR)+(10.95 ± 0.67). This trend implies that gas is consumed faster in (U)LIRGs and thus star formation is more efficient in these systems, compared to lower luminosity spiral galaxies.
Current usage metrics show cumulative count of Article Views (full-text article views including HTML views, PDF and ePub downloads, according to the available data) and Abstracts Views on Vision4Press platform.
Data correspond to usage on the plateform after 2015. The current usage metrics is available 48-96 hours after online publication and is updated daily on week days.
Initial download of the metrics may take a while.