Fig. 5.
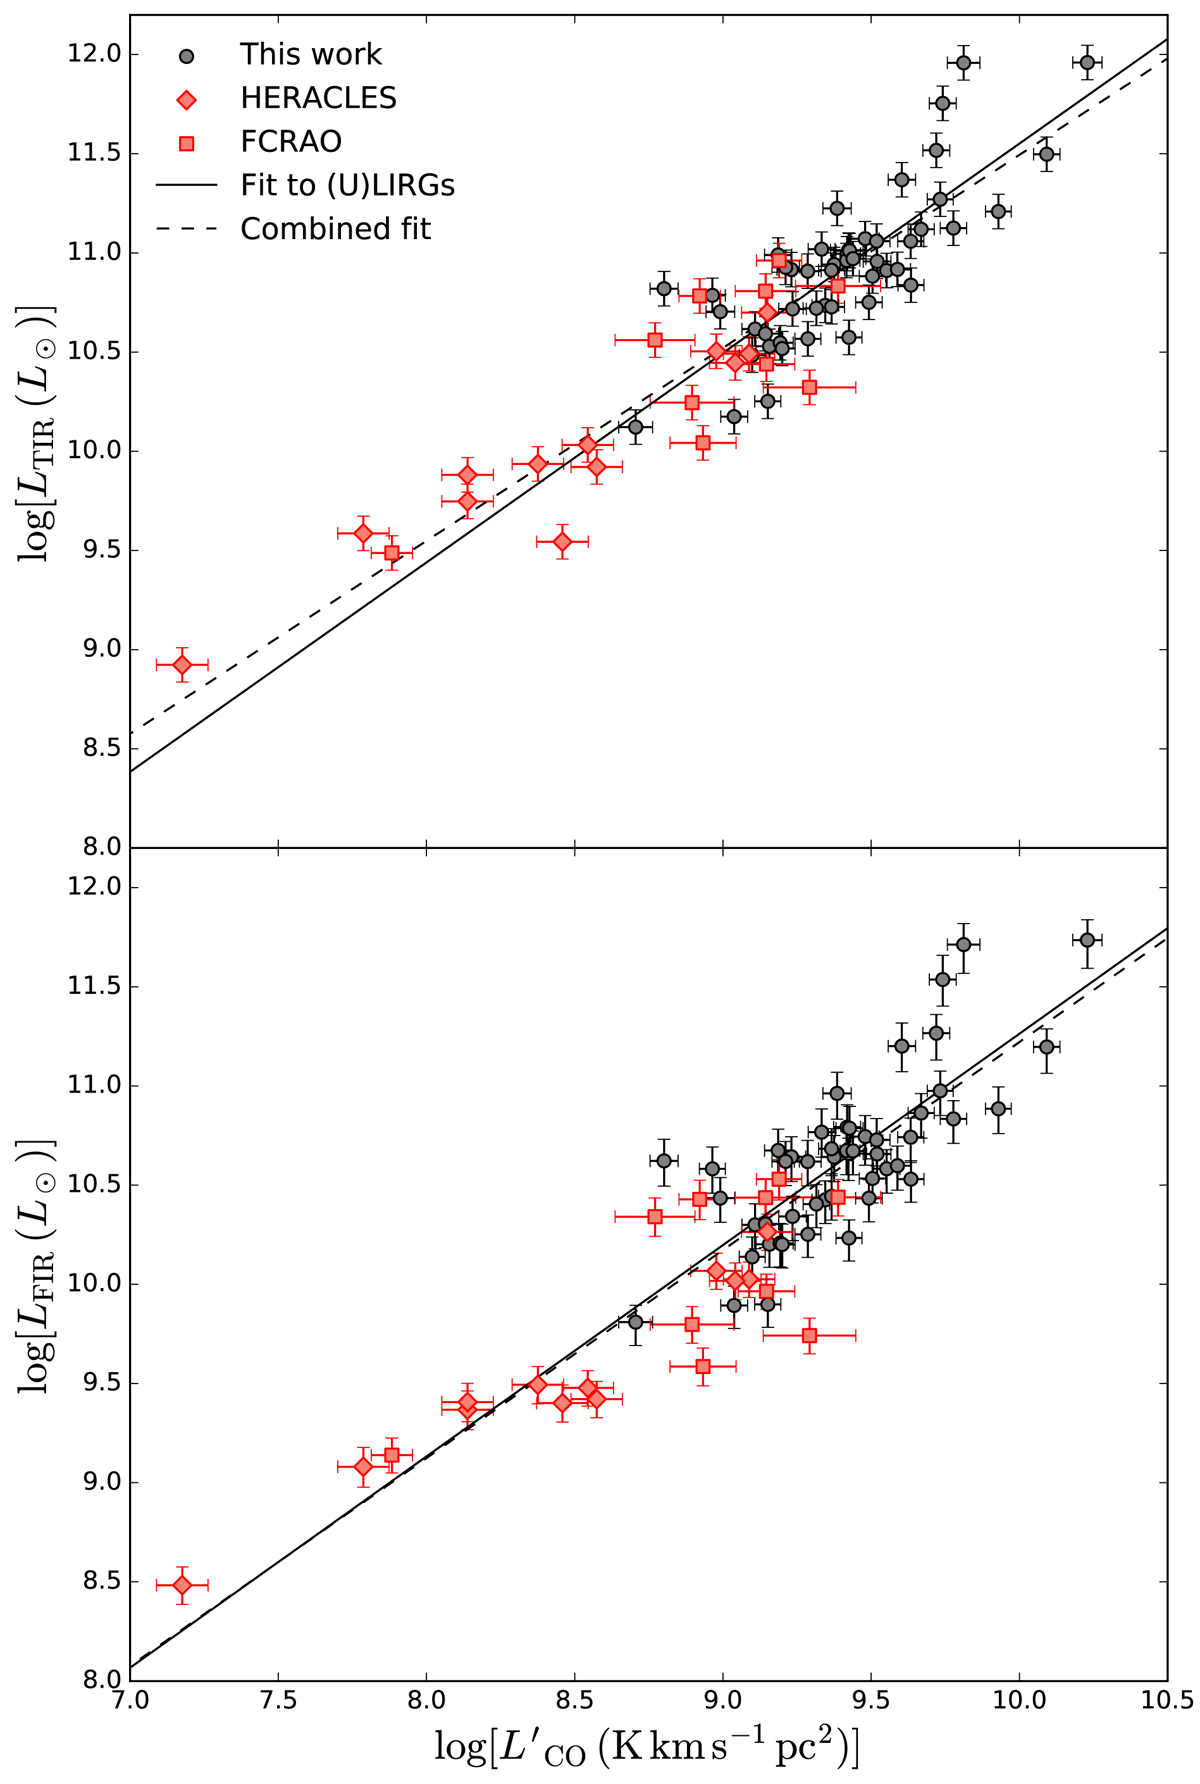
Total and far IR luminosities versus the CO luminosity. Solid lines show linear fits to our (U)LIRG sample, yielding ![]() and
and ![]() . Dashed lines are fits including the comparison samples, which also show linear slopes when using LTIR (0.97 ± 0.06) or LFIR (1.05 ± 0.06). To avoid AGN contamination, only those (U)LIRGs with an AGN bolometric fraction <0.20 (obtained from Díaz-Santos et al. 2017) were plotted and fitted.
. Dashed lines are fits including the comparison samples, which also show linear slopes when using LTIR (0.97 ± 0.06) or LFIR (1.05 ± 0.06). To avoid AGN contamination, only those (U)LIRGs with an AGN bolometric fraction <0.20 (obtained from Díaz-Santos et al. 2017) were plotted and fitted.
Current usage metrics show cumulative count of Article Views (full-text article views including HTML views, PDF and ePub downloads, according to the available data) and Abstracts Views on Vision4Press platform.
Data correspond to usage on the plateform after 2015. The current usage metrics is available 48-96 hours after online publication and is updated daily on week days.
Initial download of the metrics may take a while.