Fig. 2.
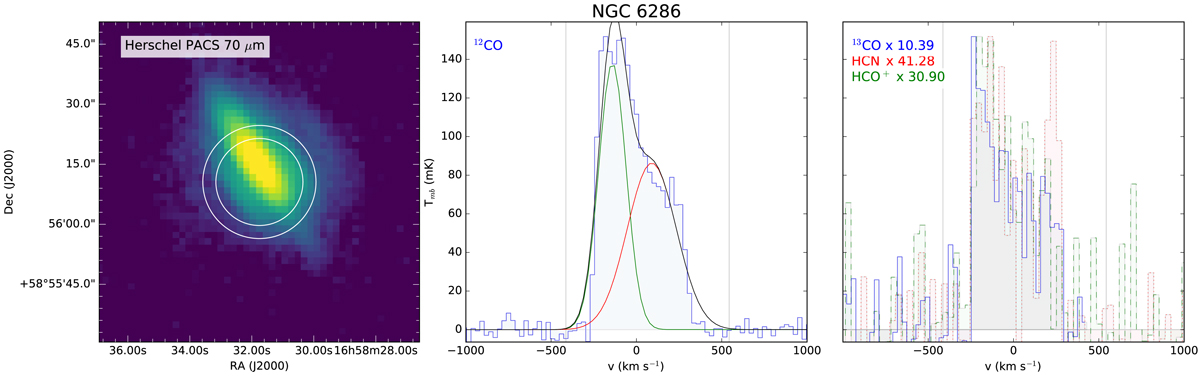
Spectral line profiles for NGC 6286. Left panel: Herschel PACS 70 μm map (see Chu et al. 2017) with a logarithmic stretch to highlight the full extent of the infrared emission relative to the IRAM-30 m Telescope. Overlaid circles represent the pointing position and beam sizes (FWHM) corresponding to the 12CO and 13CO (inner), and HCN and HCO+ (outer) IRAM observations. The middle panel shows the continuum-subtracted CO spectra, fitted with Gaussian components. Velocity frame is defined according to the redshifts quoted in Table 3. Gray vertical lines correspond to the velocity integration limits of the FWZI. Right panel: continuum-subtracted spectra of 13CO (blue, solid line), HCN (red, dotted line), and HCO+ (green, dashed line) in the same velocity range as the CO spectrum. The spectra have been normalized to the peak of the CO line, and the normalization factor is shown for each line. The complete data set with all the observations, as well as a table with the fitted Gaussian components of the 12CO spectra is shown in Appendix A.
Current usage metrics show cumulative count of Article Views (full-text article views including HTML views, PDF and ePub downloads, according to the available data) and Abstracts Views on Vision4Press platform.
Data correspond to usage on the plateform after 2015. The current usage metrics is available 48-96 hours after online publication and is updated daily on week days.
Initial download of the metrics may take a while.