Fig. 5
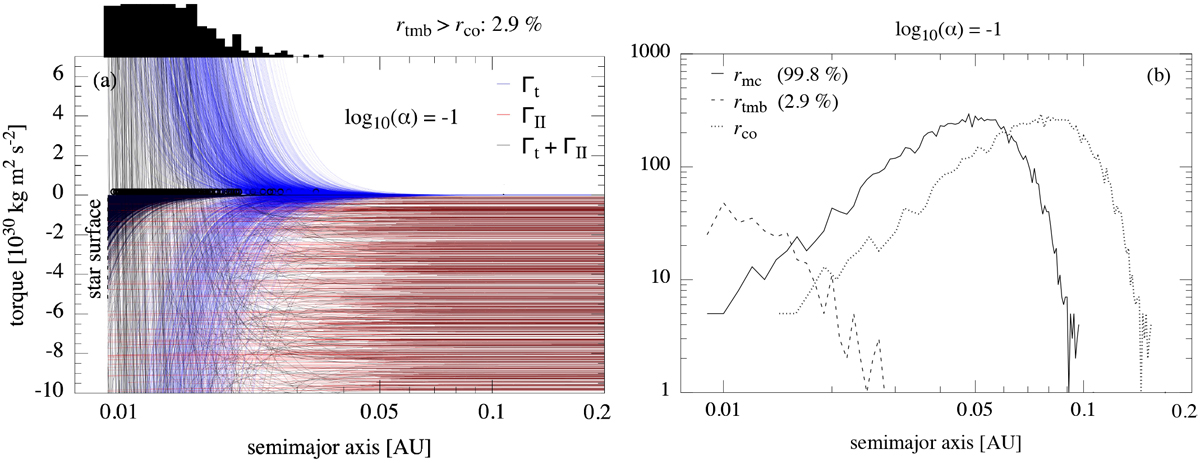
(a) Monte Carlo simulations of 10 000 different disks (with α = 10−1) and stars with stellar rotations periods drawn from a probability density distribution derived from Irwin et al. (2008) in Fig. 3. A tidal migration barrier existed in 3% of all simulations and their locations are shown in the black histogram at the top of the panel. The location of the magnetic cavity rmc was different in each simulation, depending on the stellar rotation period. (b) Histograms of the radial distance of the magnetic cavity (rmc), which existed in 90% of all simulations, and of the tidal migration barrier (rtmb). The corotation radius distribution is plotted at 1/0.63 times rmc.
Current usage metrics show cumulative count of Article Views (full-text article views including HTML views, PDF and ePub downloads, according to the available data) and Abstracts Views on Vision4Press platform.
Data correspond to usage on the plateform after 2015. The current usage metrics is available 48-96 hours after online publication and is updated daily on week days.
Initial download of the metrics may take a while.