Fig. 10
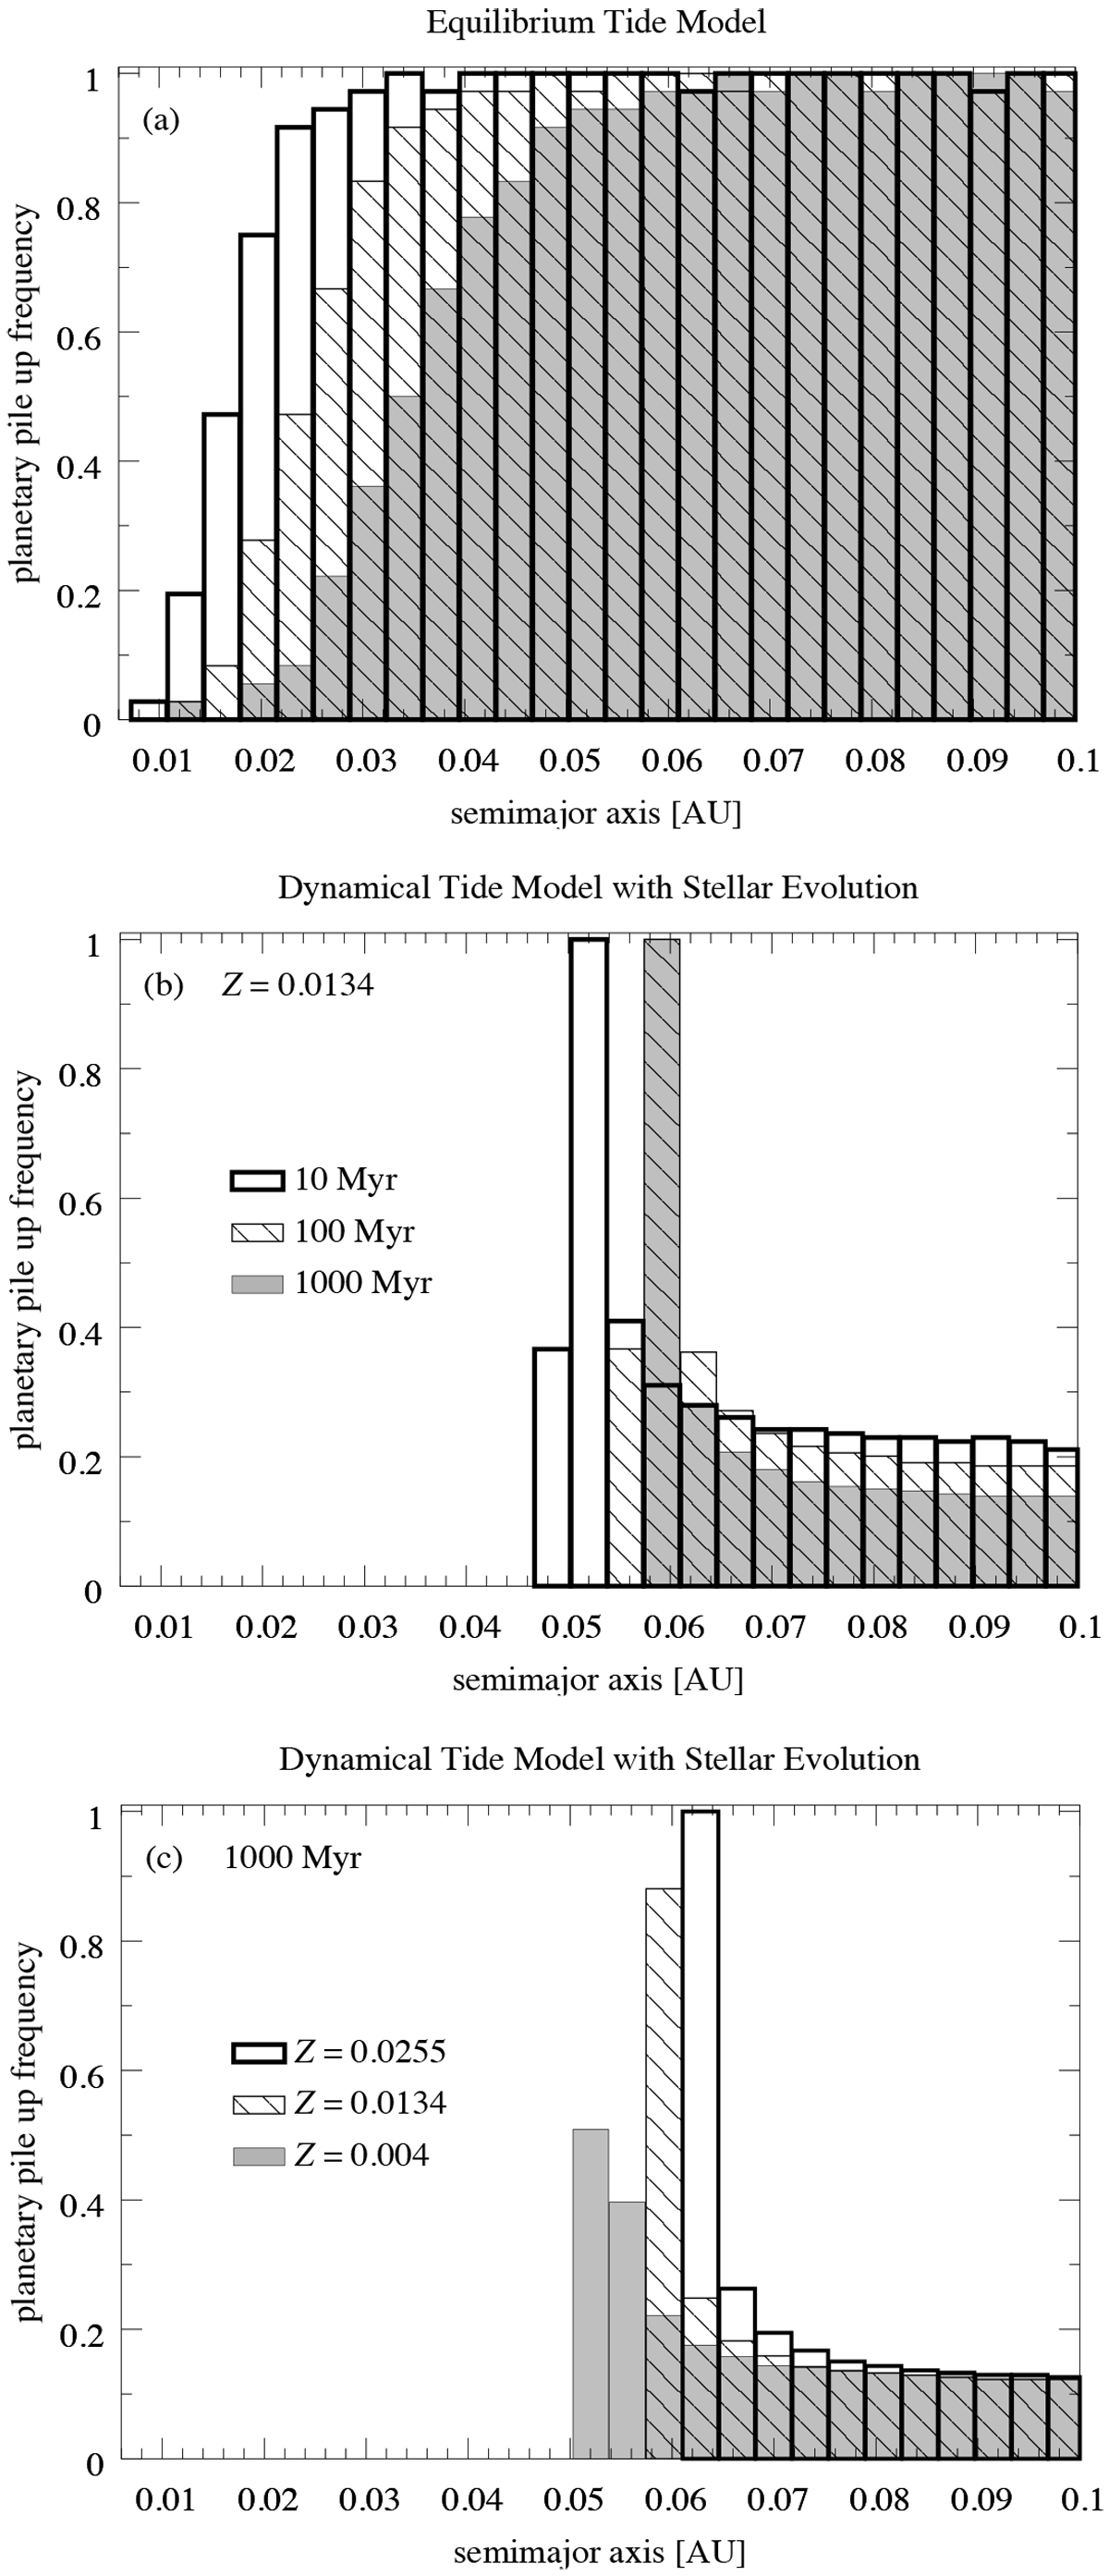
Normalized histograms of 911 orbital integrations of a Jupiter-mass planet around a Sun-like star as per Fig. 9f. (a) Assumes the equilibrium tide model and a fixed Q⋆ = 105. (b) Based on the dynamical tide model with stellar evolution of a sun-like star (metallicity Z = 0.0134). In a and b, each histogram is normalized to a maximum of 1 and different shadings refer to different integration times of our numerical code; see legend in b. (c) Different histogram shadings refer to simulated hot-Jupiter populations around stars in the dynamical tide model and stellar evolution with sub-solar (Z = 0.004), solar (Z = 0.0134), and super-solar (Z = 0.0255) metallicities after 1000 Myr. These histograms are scaled to agree at 0.1 AU, beyond which tides become insignificant.
Current usage metrics show cumulative count of Article Views (full-text article views including HTML views, PDF and ePub downloads, according to the available data) and Abstracts Views on Vision4Press platform.
Data correspond to usage on the plateform after 2015. The current usage metrics is available 48-96 hours after online publication and is updated daily on week days.
Initial download of the metrics may take a while.