Fig. 3.
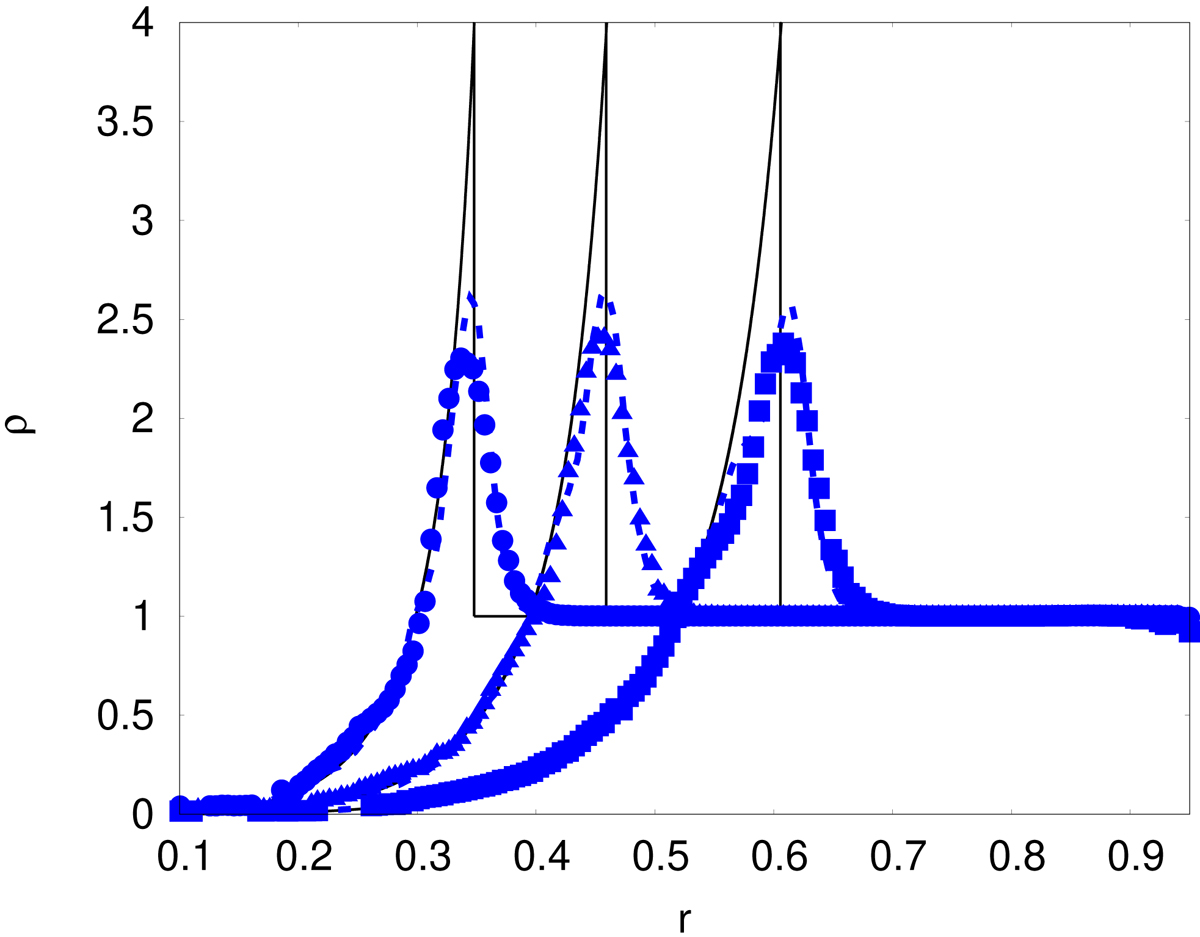
Radial density profiles of the Sedov–Taylor blast wave at several times (increasing rightward) t = 0.05 (circles), t = 0.1 (triangles), and t = 0.2 (squares) in a simulation with N = 106. The results obtained using a higher resolution (N = 3 375 000) are plotted with dotted lines. The full lines represent the classical Sedov–Taylor auto-similar solutions.
Current usage metrics show cumulative count of Article Views (full-text article views including HTML views, PDF and ePub downloads, according to the available data) and Abstracts Views on Vision4Press platform.
Data correspond to usage on the plateform after 2015. The current usage metrics is available 48-96 hours after online publication and is updated daily on week days.
Initial download of the metrics may take a while.