Fig. 2.
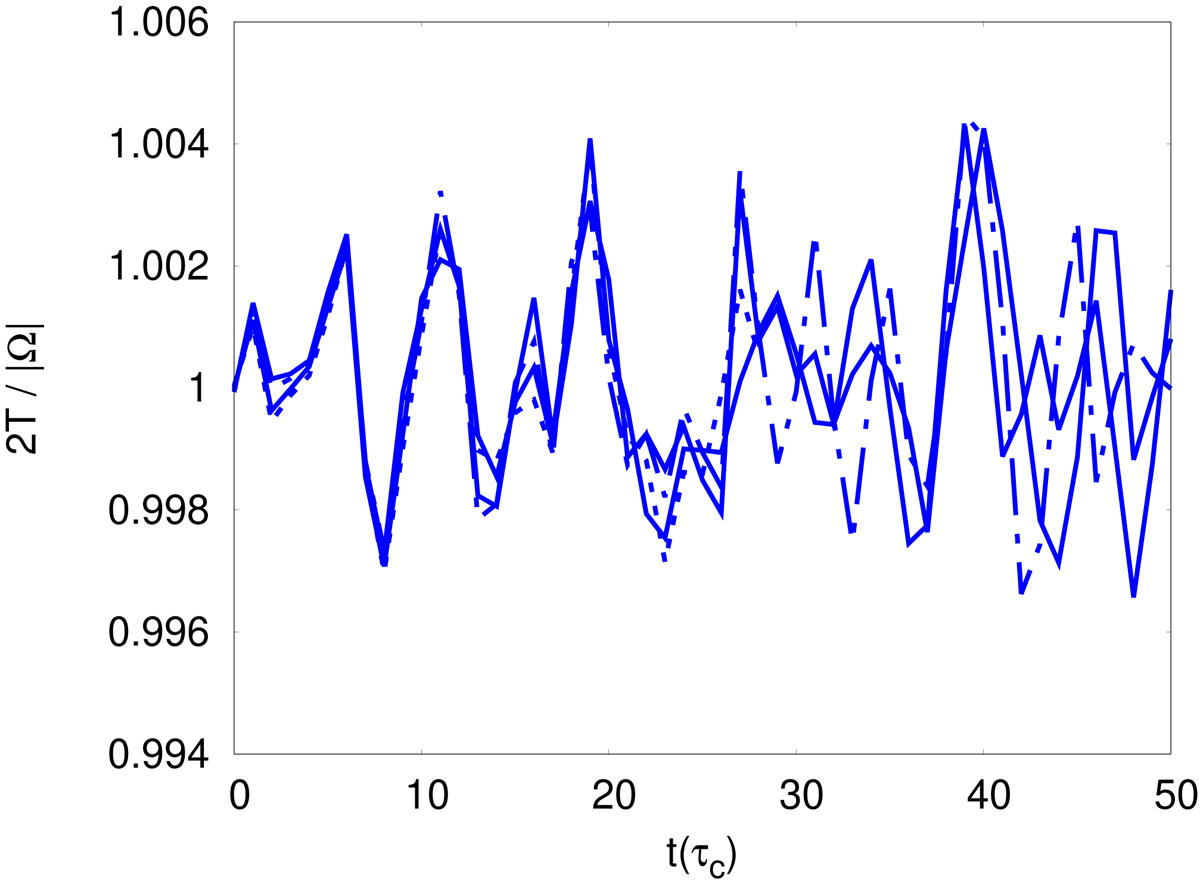
Oscillation of the virial ratio as a function of time for different choices of code configuration parameters for the simulation of a Plummer distribution of 105 equal-mass particles. The continuous line shows θ = 0.6, ϵ = 0.2; the dashed line represents θ = 1.0, ϵ = 0.2; the dotted line shows θ = 0.6, ϵ = 0.5; and the dash-dotted line denotes θ = 1.0, ϵ = 0.5.
Current usage metrics show cumulative count of Article Views (full-text article views including HTML views, PDF and ePub downloads, according to the available data) and Abstracts Views on Vision4Press platform.
Data correspond to usage on the plateform after 2015. The current usage metrics is available 48-96 hours after online publication and is updated daily on week days.
Initial download of the metrics may take a while.