Fig. 16.
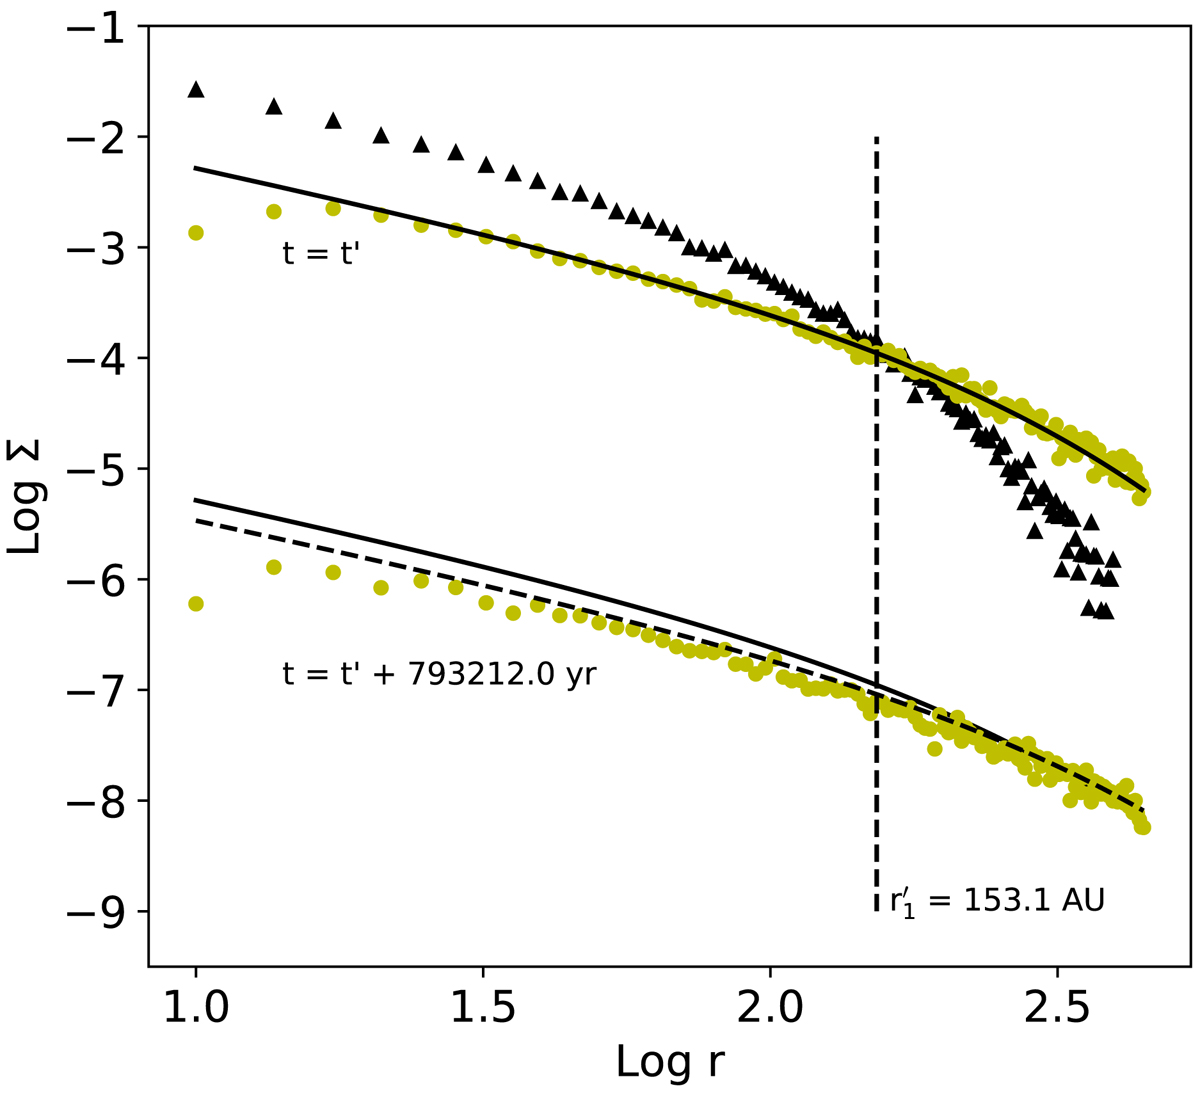
Logarithm of the numerical radial profile of the disk density at t′=850 000 yr (dots). The density profile at the beginning of the simulation is also plotted (black triangles). The density at t = t′ matches the self-similar solution (Eq. (36)) with a parameter ![]() AU and a viscosity timescale
AU and a viscosity timescale ![]() yr. The evolution of this disk after a time
yr. The evolution of this disk after a time ![]() is also plotted (bottom, artificially shifted by −3) together with the analytical prediction (dashed line). The fit density profile at t = t′ is plotted twice (in the top and bottom curves) as a full line for clarity.
is also plotted (bottom, artificially shifted by −3) together with the analytical prediction (dashed line). The fit density profile at t = t′ is plotted twice (in the top and bottom curves) as a full line for clarity.
Current usage metrics show cumulative count of Article Views (full-text article views including HTML views, PDF and ePub downloads, according to the available data) and Abstracts Views on Vision4Press platform.
Data correspond to usage on the plateform after 2015. The current usage metrics is available 48-96 hours after online publication and is updated daily on week days.
Initial download of the metrics may take a while.