Fig. 14.
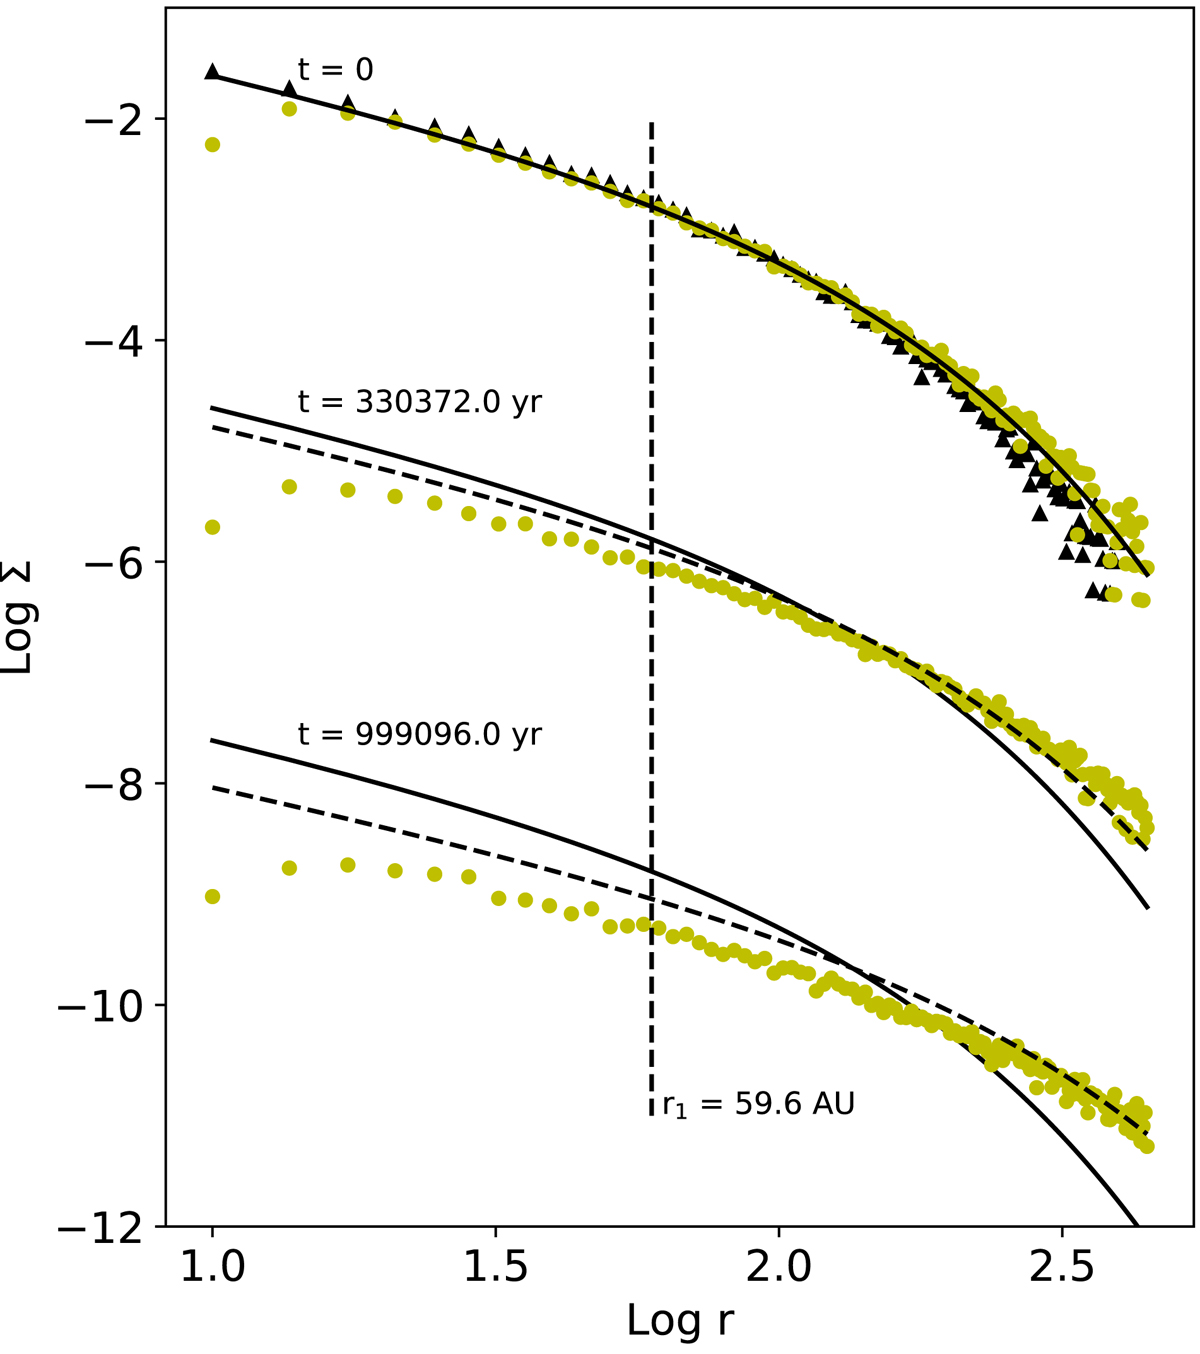
Surface density profiles Σ(R) of the disk at different times (t = 0 corresponds to the disk state after it has been relaxed up to a time of 50 000 yr). The dots represent the numerical results, while the lines refer to the analytical model (Eq. (35)). The actual initial disk setting (black triangles) is reported for the sake of comparison with the relaxed state. The abscissa is in AU and the density is expressed in 10−2 M⊙ AU−2. The evolved density profiles at t > 0 (t = 330 000 yr and t = 1 000 000 yr) are shifted down by −3 and −6 in logarithm, respectively, for clarity. The fitting curve of the density profile at t = 0 is also plotted (full lines).
Current usage metrics show cumulative count of Article Views (full-text article views including HTML views, PDF and ePub downloads, according to the available data) and Abstracts Views on Vision4Press platform.
Data correspond to usage on the plateform after 2015. The current usage metrics is available 48-96 hours after online publication and is updated daily on week days.
Initial download of the metrics may take a while.