Fig. 8
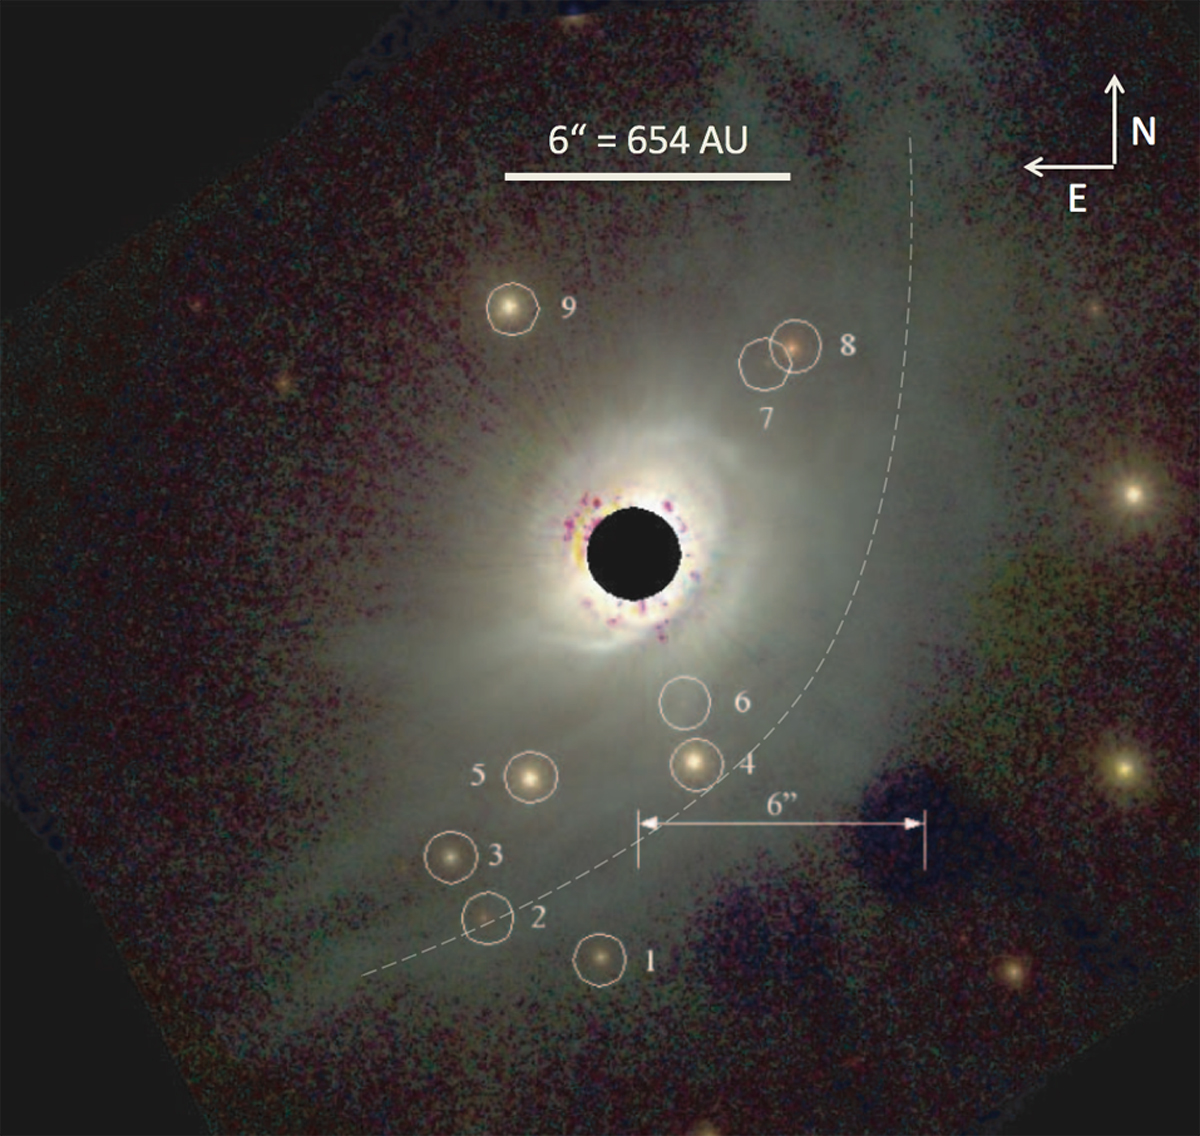
Image of HD100546 from Ardila et al. (2007) (their Fig. 5) with RGB color coding according to R = B-band, G = V-band and B = I-band. The scale bar is 6′′ which for d = 109 pc (Gaia DR1 data release: Gaia Collaboration 2016) amounts to 654 AU. The image shows the disk in the center out to at least 300 AU, and a much fainter, much larger arc-shaped envelope out to 1000 AU going from south, via south-west to north-west (a dashed line was added to the image to indicate its position, as it is rather faint). Image used with permission of the authors of the referenced paper.
Current usage metrics show cumulative count of Article Views (full-text article views including HTML views, PDF and ePub downloads, according to the available data) and Abstracts Views on Vision4Press platform.
Data correspond to usage on the plateform after 2015. The current usage metrics is available 48-96 hours after online publication and is updated daily on week days.
Initial download of the metrics may take a while.