Free Access
Fig. 3
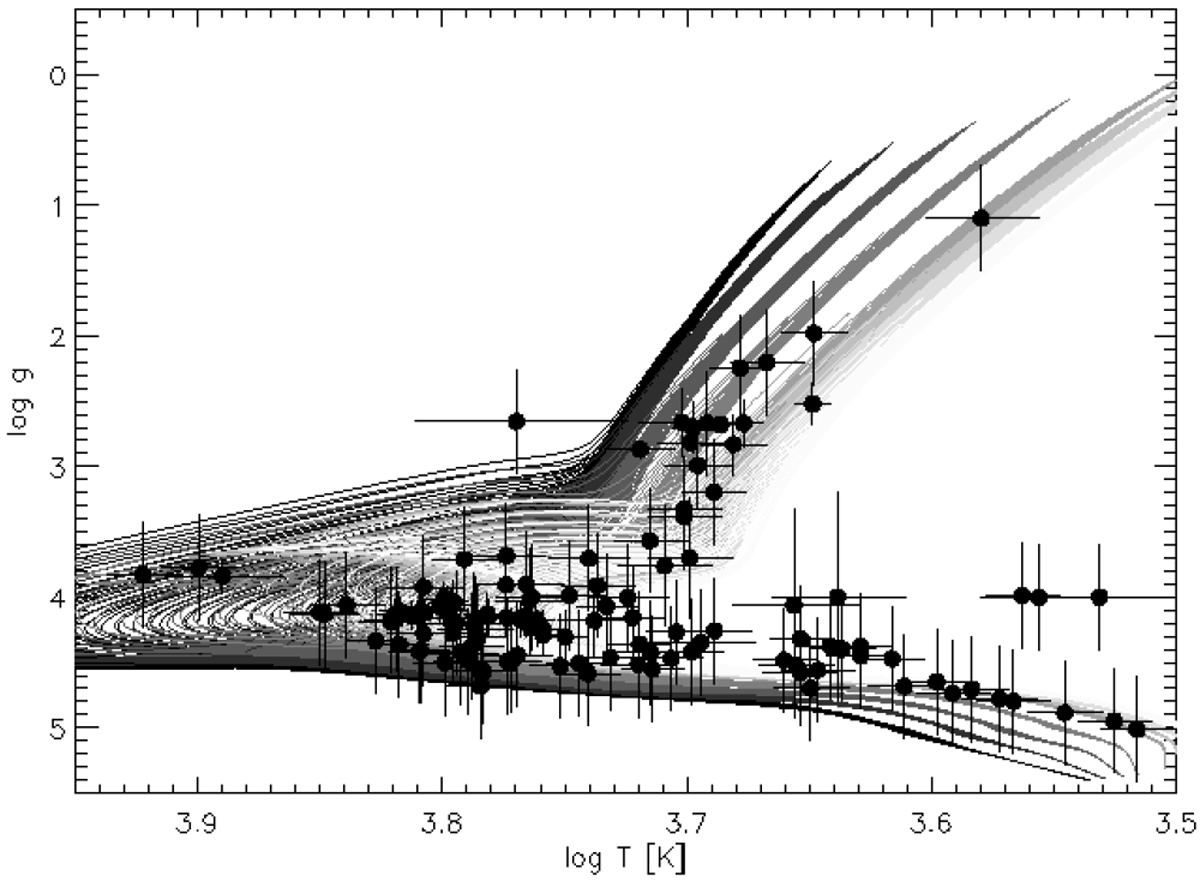
log g −log Teff space with the set of isochrones from DSEP and the stars of our sample (black circles) overplotted. Each stack of isochrones (lines in different gray-shades) corresponds to a given value of [Fe/H] (−2.0, − 1.5, − 1.0, − 0.5, 0.0, 0.2, 0.3, 0.5 from dark to pale).
Current usage metrics show cumulative count of Article Views (full-text article views including HTML views, PDF and ePub downloads, according to the available data) and Abstracts Views on Vision4Press platform.
Data correspond to usage on the plateform after 2015. The current usage metrics is available 48-96 hours after online publication and is updated daily on week days.
Initial download of the metrics may take a while.