Fig. 2
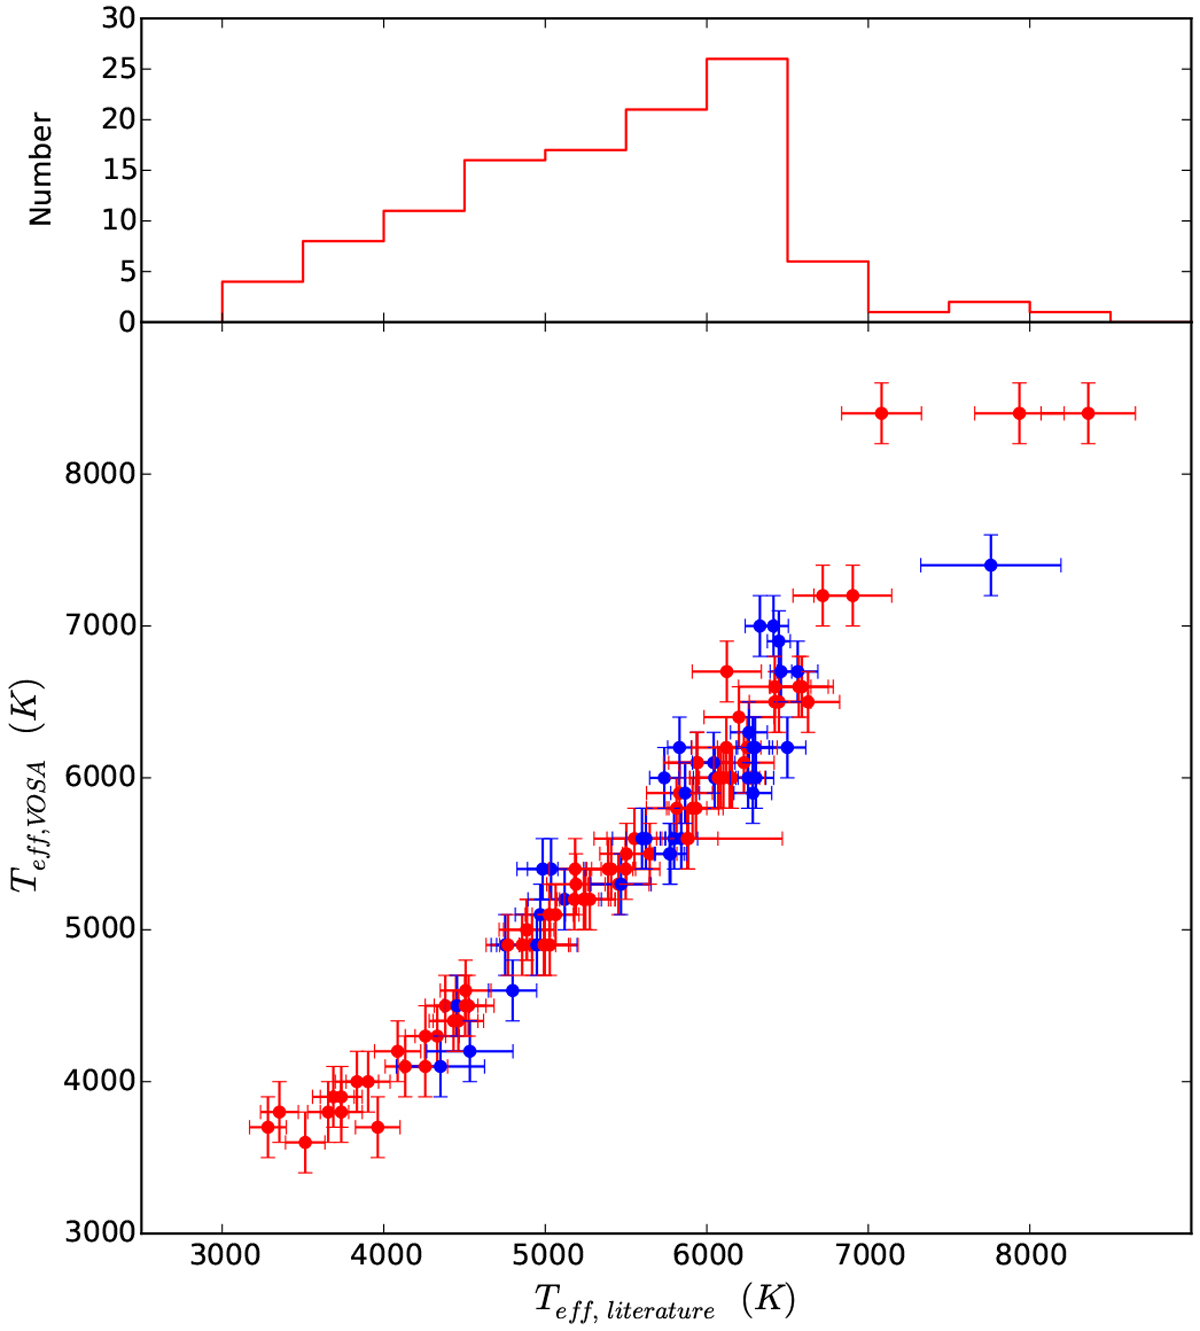
Upper panel: distribution of the Teff of the 119 stars in our sample with Teff taken from the literature (Huber et al. 2014; Frasca et al. 2016). Lower panel: comparison between the Teff drawn from the literature and the ones obtained with the SED fitting is reported for thesame sample of stars. The colors represent the original work in which the Teff was derived.Blue: Frasca et al. (2016); red: Huber et al. (2014).
Current usage metrics show cumulative count of Article Views (full-text article views including HTML views, PDF and ePub downloads, according to the available data) and Abstracts Views on Vision4Press platform.
Data correspond to usage on the plateform after 2015. The current usage metrics is available 48-96 hours after online publication and is updated daily on week days.
Initial download of the metrics may take a while.