Free Access
Fig. 16
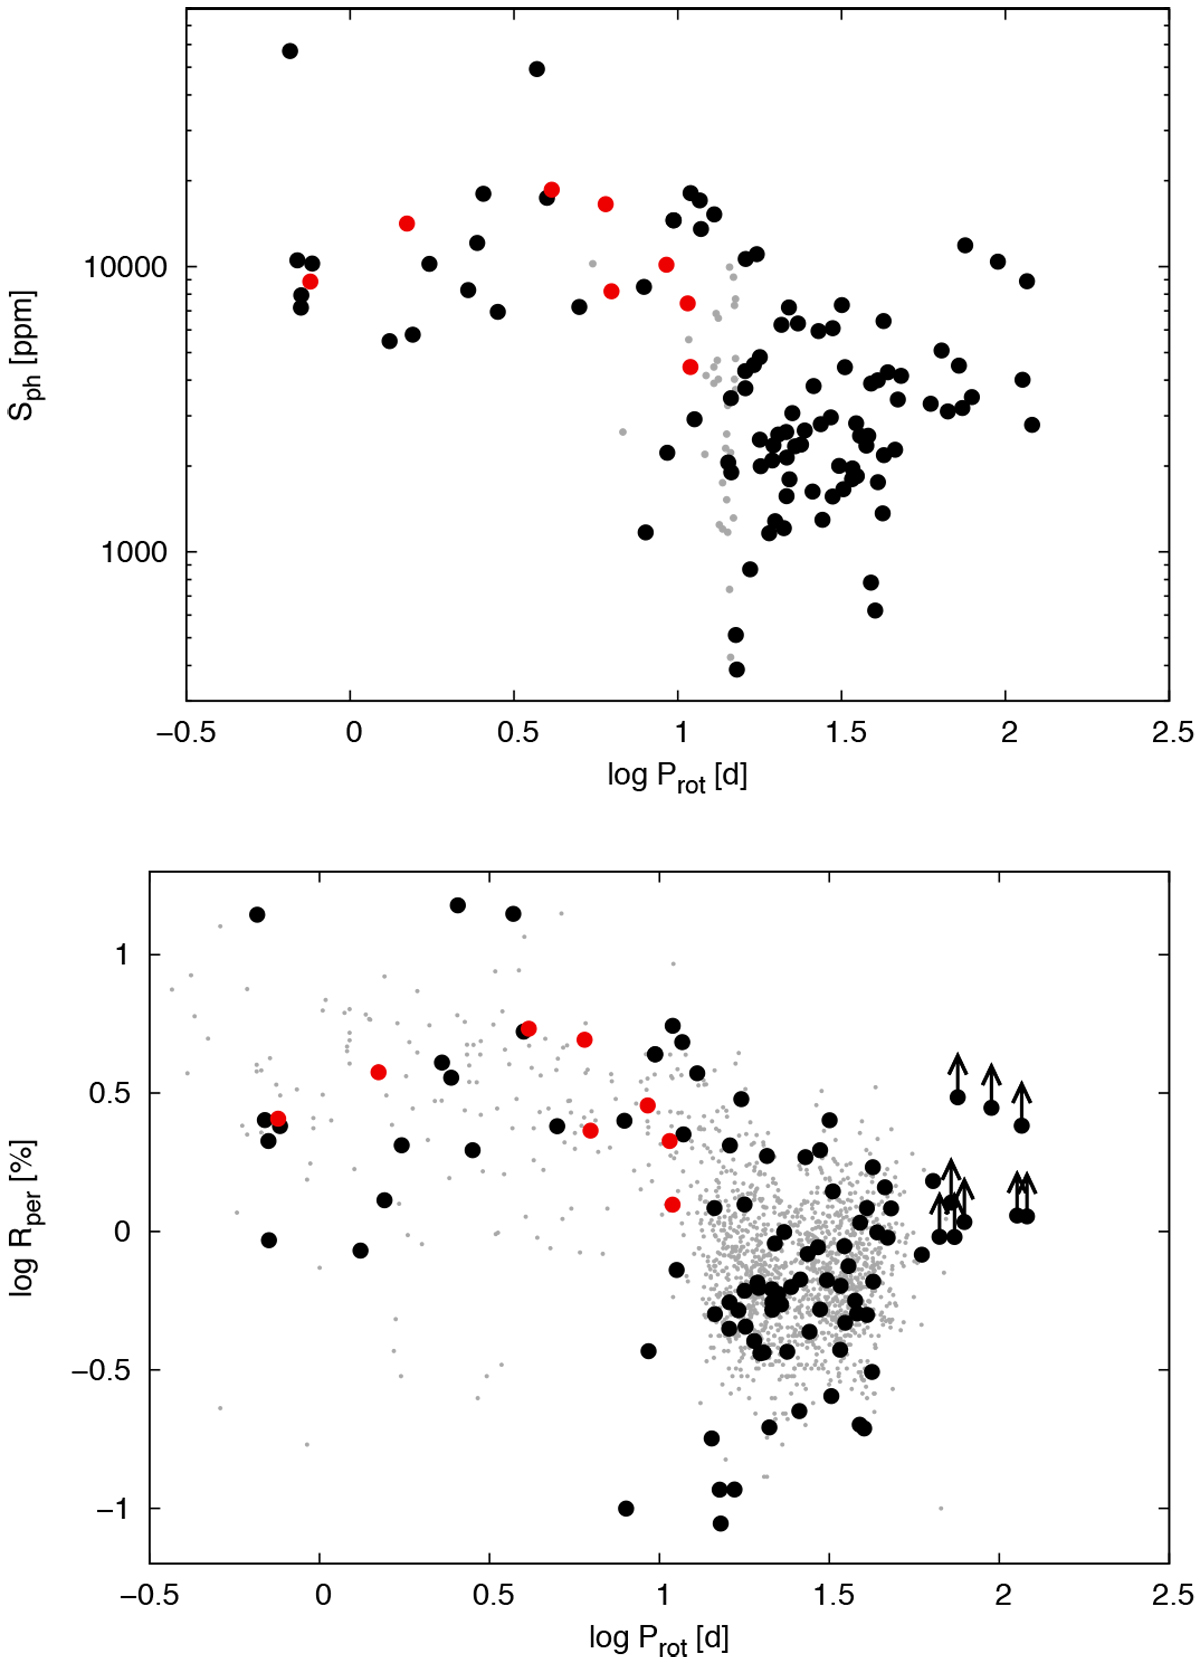
Photometric activity diagnostics versus rotation period for M stars. Red dots – M stars in our sample; black dots – K2 M dwarf sample of Stelzer et al. (2016); gray dots – field M dwarfs in the sample by Mathur et al. (2014a) in the top panel and field M dwarfs from McQuillan et al. (2013) in the bottom panel.
Current usage metrics show cumulative count of Article Views (full-text article views including HTML views, PDF and ePub downloads, according to the available data) and Abstracts Views on Vision4Press platform.
Data correspond to usage on the plateform after 2015. The current usage metrics is available 48-96 hours after online publication and is updated daily on week days.
Initial download of the metrics may take a while.