Free Access
Fig. 15
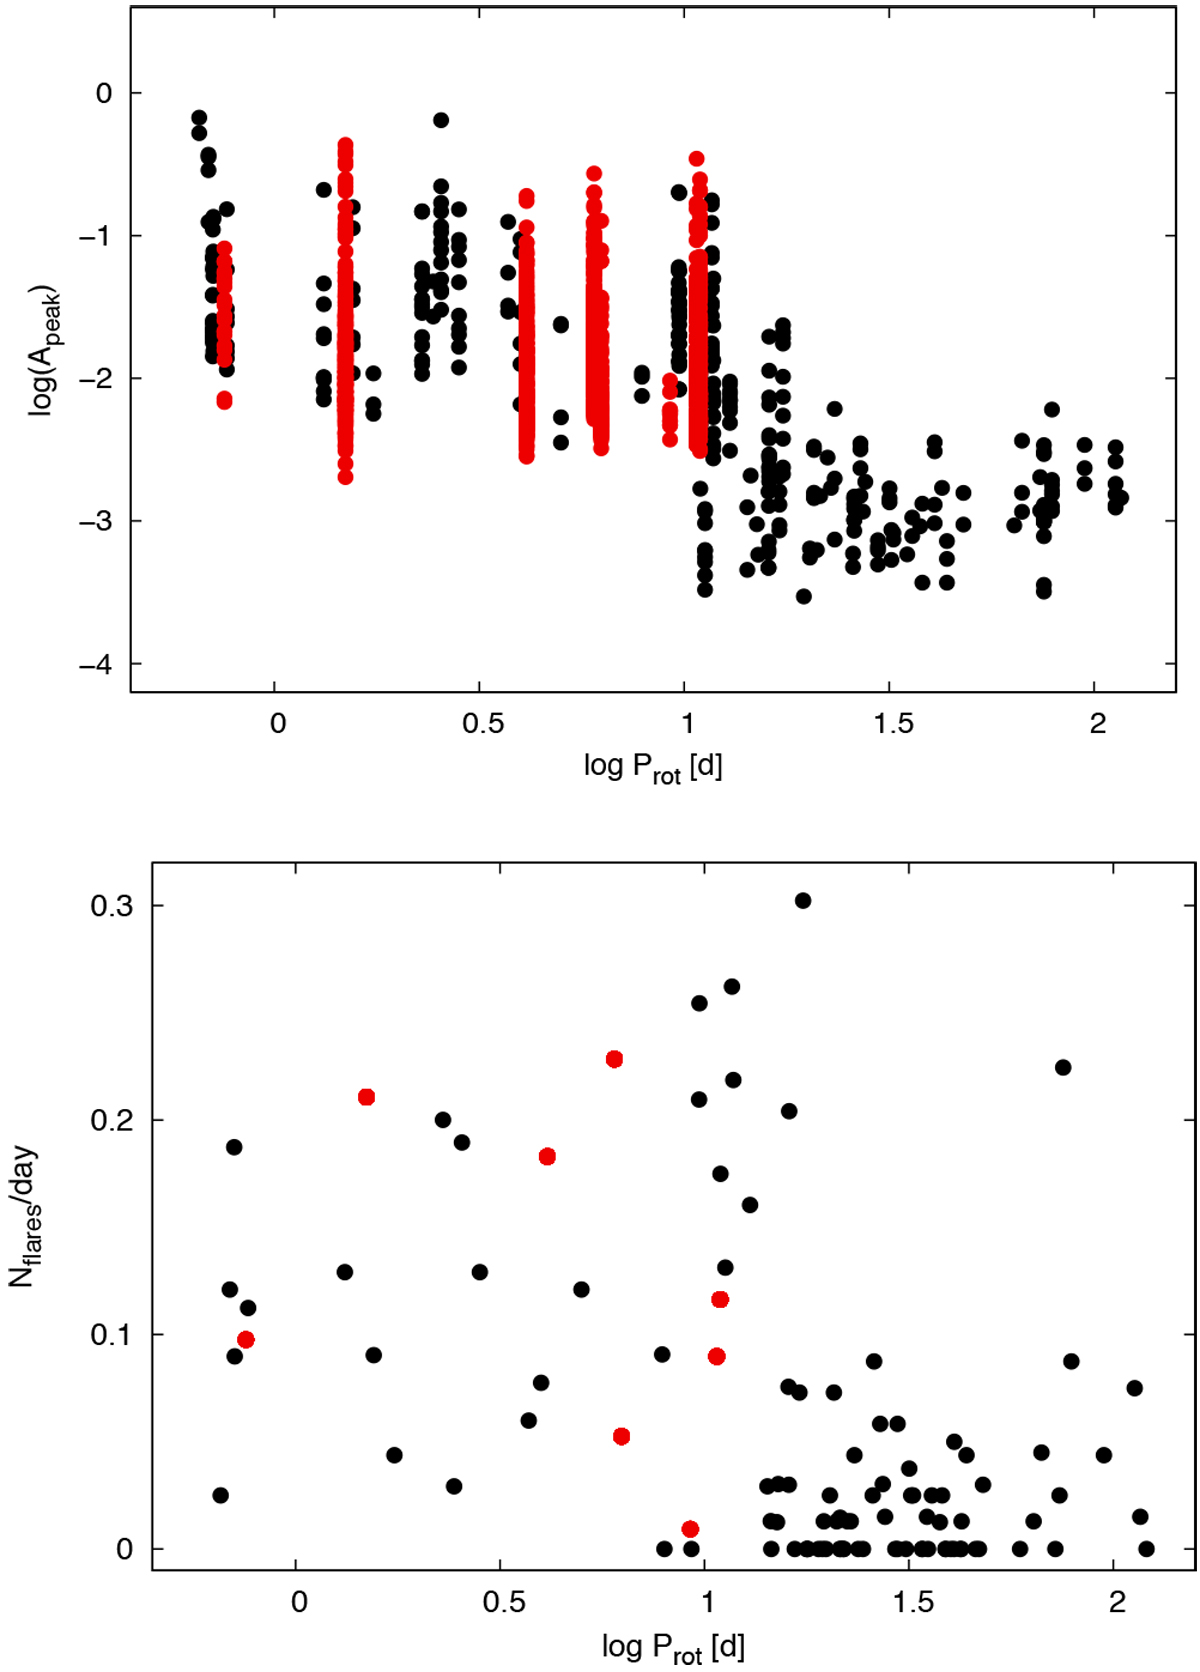
Relative flare amplitudes (Apeak; top panel) and flare frequency (bottom panel) versus rotation period for the M stars in our Kepler sample (red) and for the M stars of the K2 sample presented by Stelzer et al. (2016) (black).
Current usage metrics show cumulative count of Article Views (full-text article views including HTML views, PDF and ePub downloads, according to the available data) and Abstracts Views on Vision4Press platform.
Data correspond to usage on the plateform after 2015. The current usage metrics is available 48-96 hours after online publication and is updated daily on week days.
Initial download of the metrics may take a while.