Free Access
Fig. 13
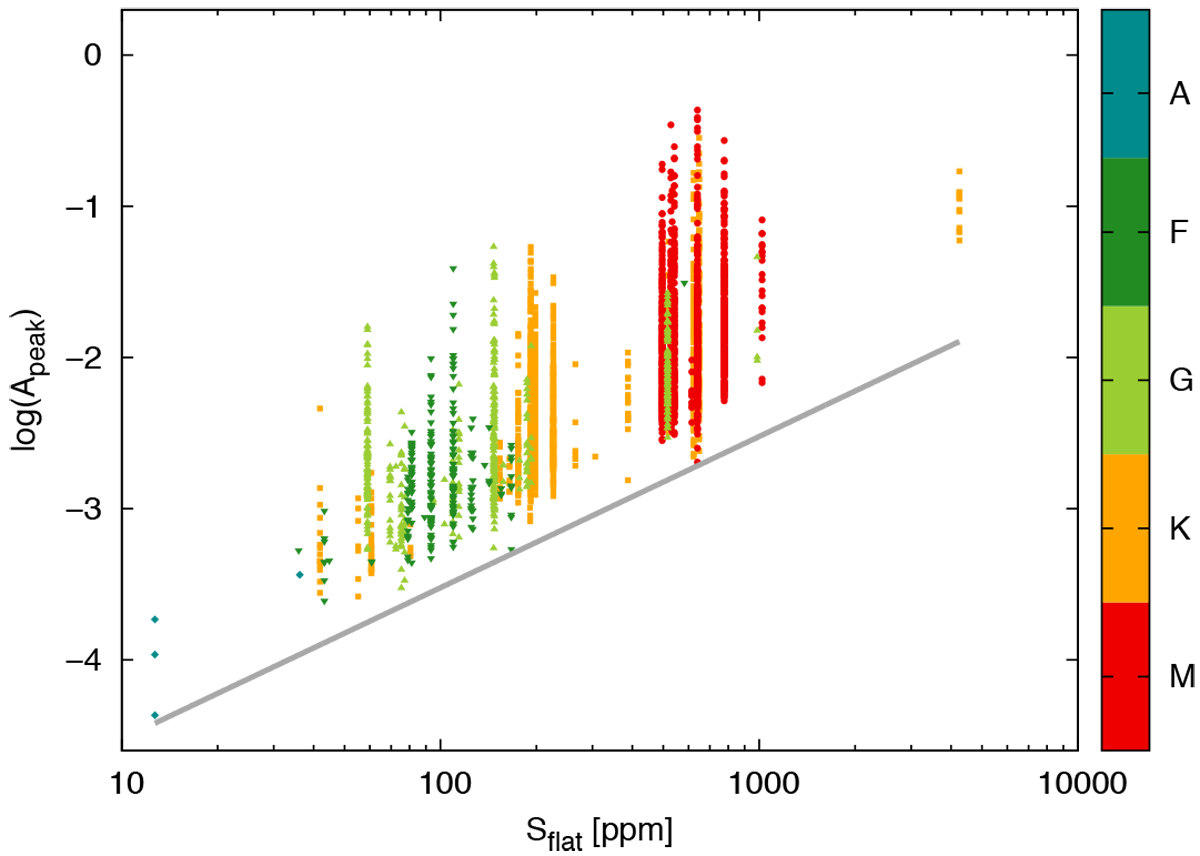
Relative peak amplitudes of all detected optical flares in the Kepler lightcurves measured with respect to the flattened lightcurve. The gray line denotes our threshold for flare detection set to 3 × Sflat.
Current usage metrics show cumulative count of Article Views (full-text article views including HTML views, PDF and ePub downloads, according to the available data) and Abstracts Views on Vision4Press platform.
Data correspond to usage on the plateform after 2015. The current usage metrics is available 48-96 hours after online publication and is updated daily on week days.
Initial download of the metrics may take a while.