Free Access
Fig. 12
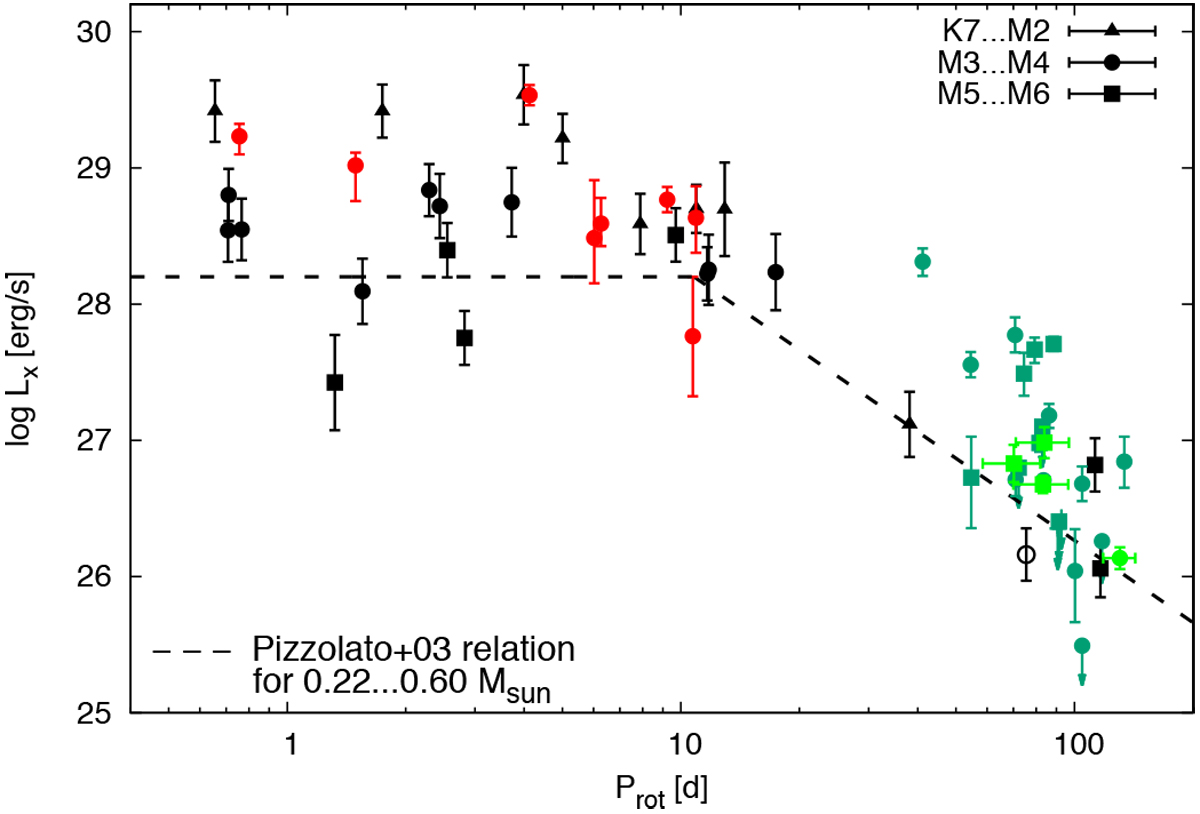
LX vs. Prot for M dwarfs: red – this work, black – K2 sample from Stelzer et al. (2016) (their Fig. 15), green – stars published by Wright & Drake (2016) and Wright et al. (2018). The solid line represents the best-fit rotation-activity relation from Pizzolato et al. (2003) in the range 0.22–0.60 M⊙.
Current usage metrics show cumulative count of Article Views (full-text article views including HTML views, PDF and ePub downloads, according to the available data) and Abstracts Views on Vision4Press platform.
Data correspond to usage on the plateform after 2015. The current usage metrics is available 48-96 hours after online publication and is updated daily on week days.
Initial download of the metrics may take a while.