Fig. 11
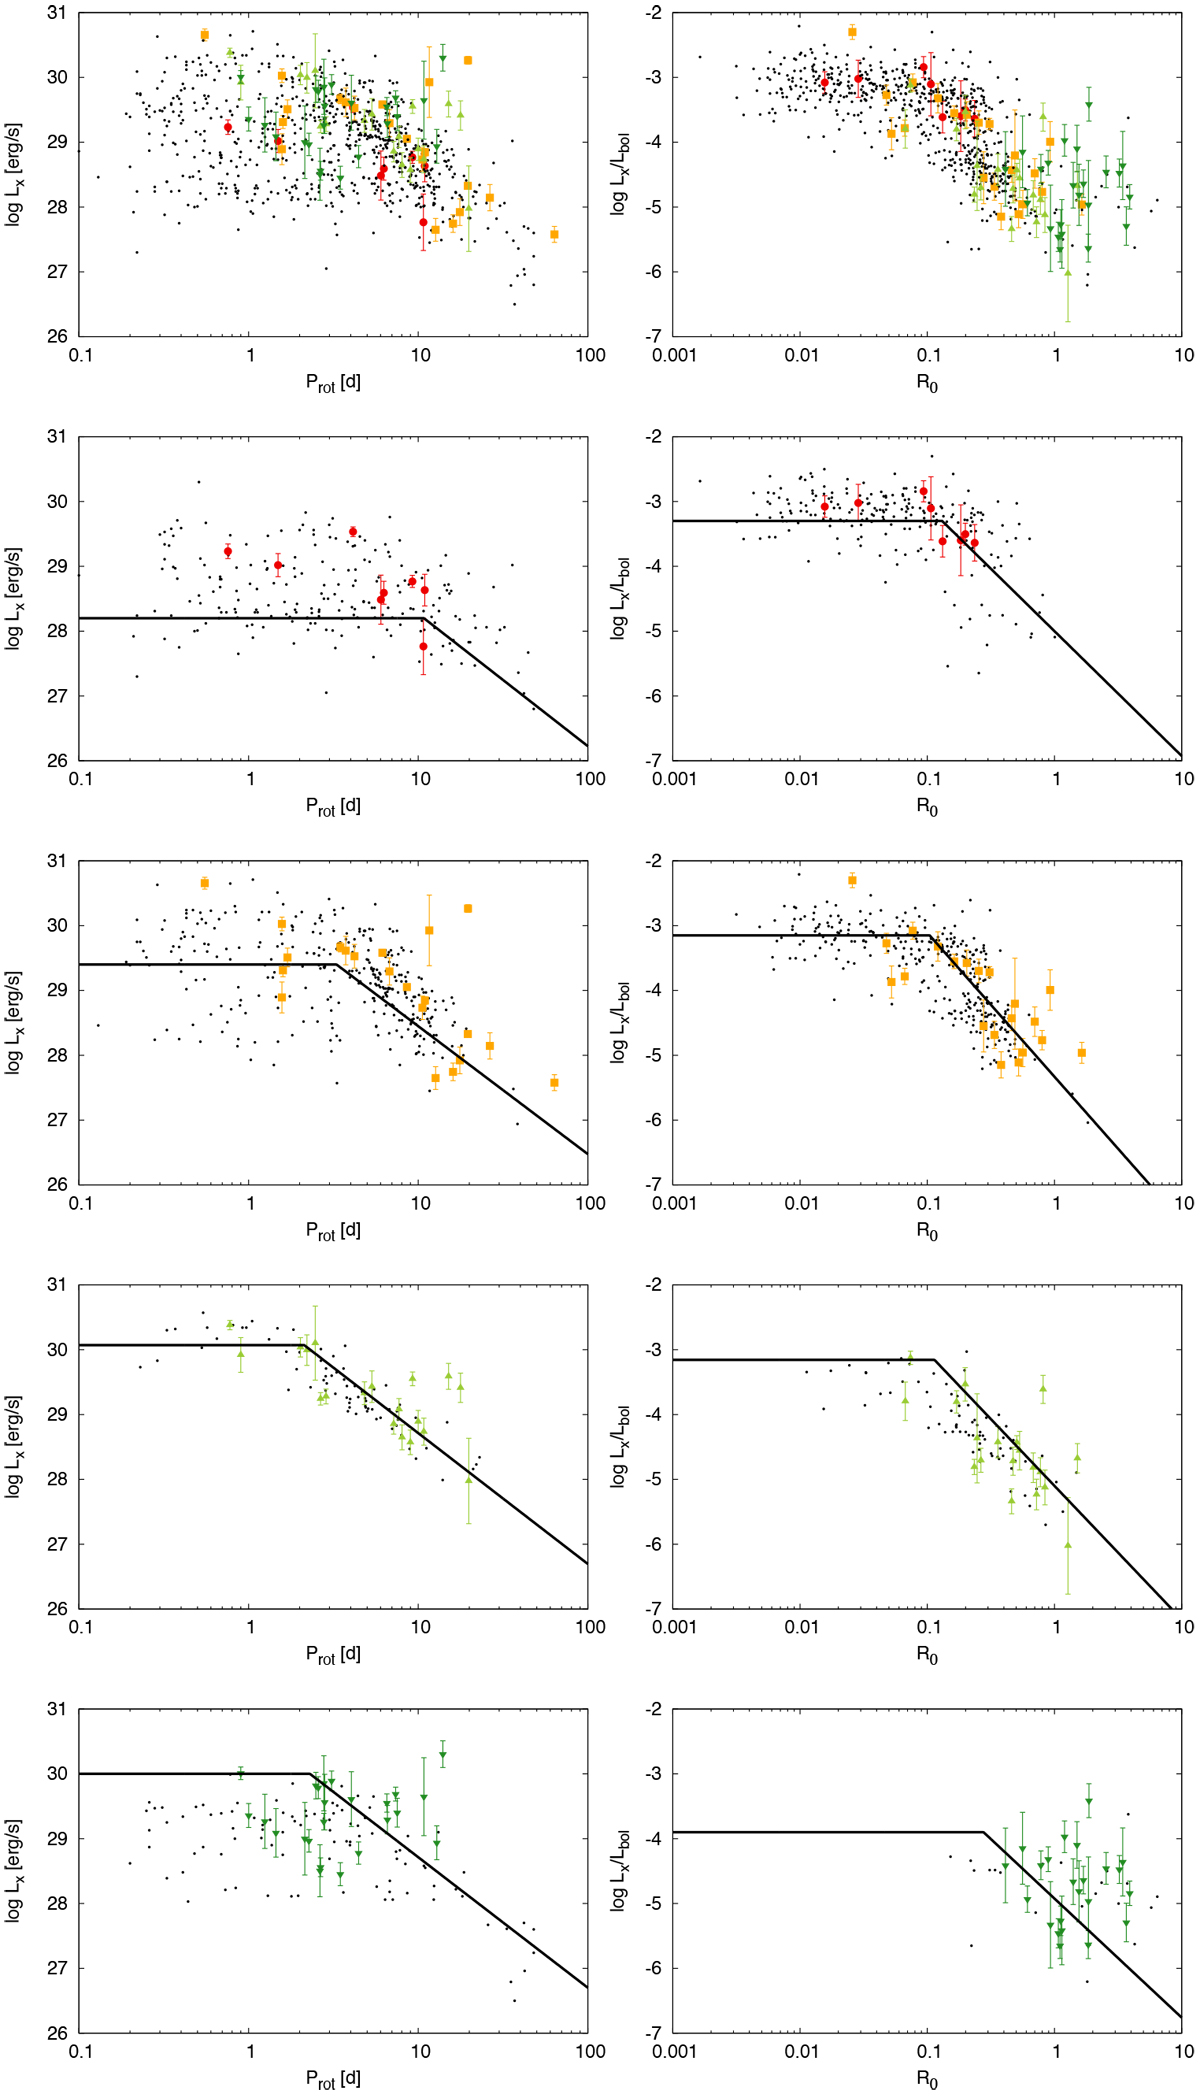
X-ray activity versus rotation for the full sample, M-, K-, G-, and F-type stars (from top to bottom). Left panels: X-ray luminosity in the energy band 0.2− 2.0 keV versus Kepler Prot. Right panels: X-ray activity index versus Rossby number. Colours and symbols follow the convention defined in Fig. 10. The stars in the sample of Wright et al. (2011) are shown as small black dots. The solid lines represent the best-fit relations between X-ray emission and rotation period found by Pizzolato et al. (2003) for stellar mass ranges corresponding approximately to spectral types.
Current usage metrics show cumulative count of Article Views (full-text article views including HTML views, PDF and ePub downloads, according to the available data) and Abstracts Views on Vision4Press platform.
Data correspond to usage on the plateform after 2015. The current usage metrics is available 48-96 hours after online publication and is updated daily on week days.
Initial download of the metrics may take a while.