Fig. 7.
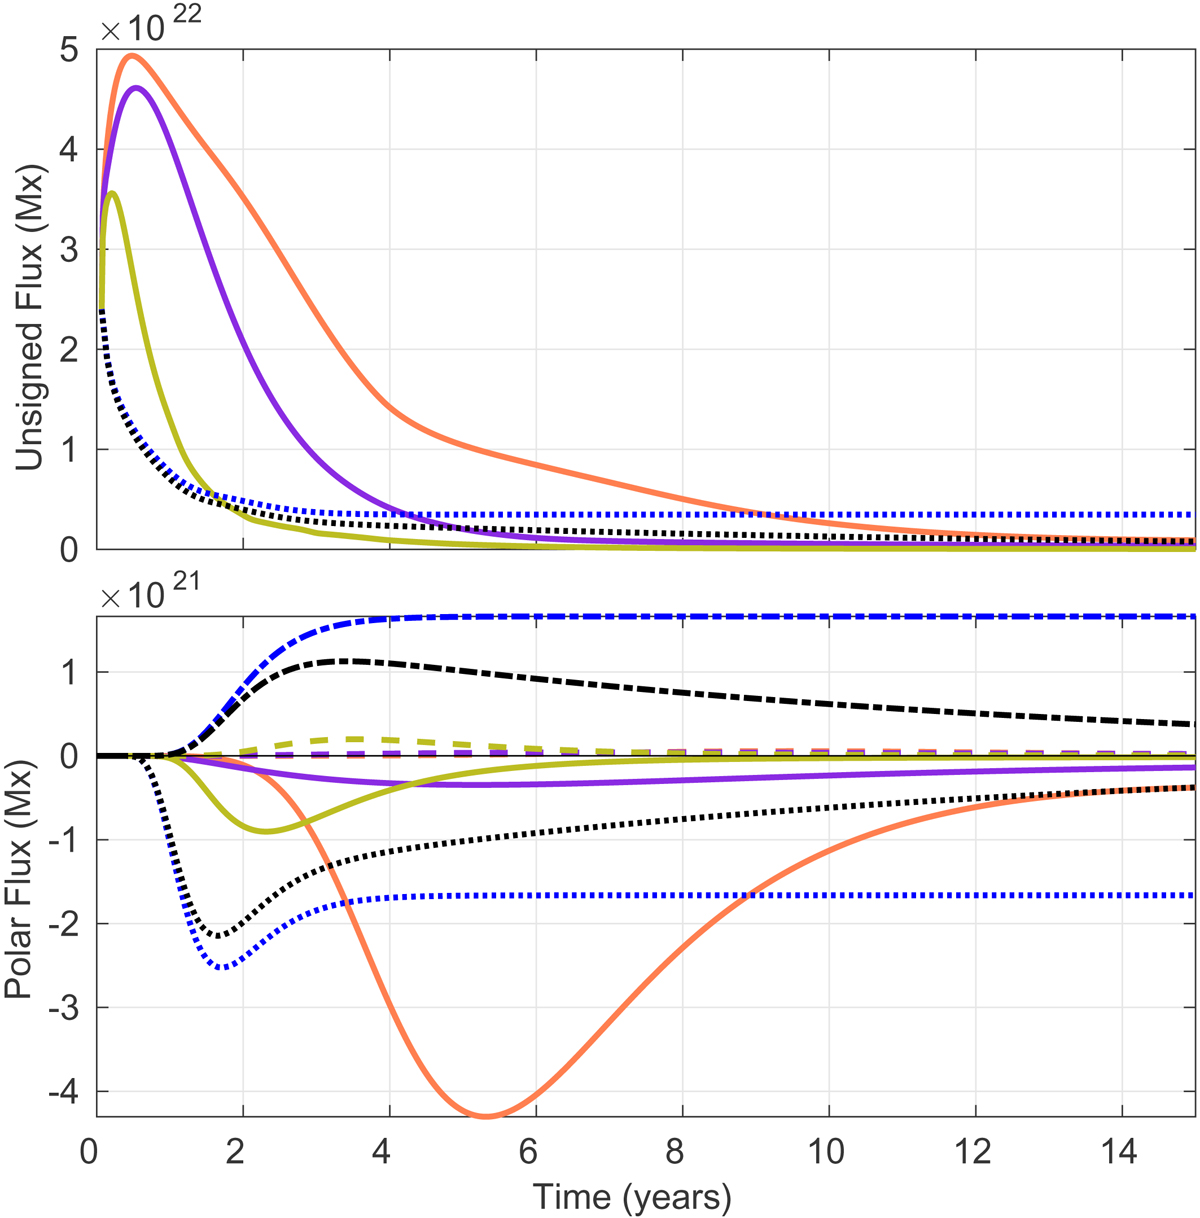
Top: unsigned surface flux from 3D simulations of a single active region, using the KD3 diffusion profile (orange), quenching profile (purple) and MLT profile (yellow). The equivalent 2D SFT flux is shown in the dotted blue (without decay) and black (with decay) curves. Bottom: northern polar flux (solid and dotted curves) and southern polar flux (dashed and dash-dotted curves) from the same simulations.
Current usage metrics show cumulative count of Article Views (full-text article views including HTML views, PDF and ePub downloads, according to the available data) and Abstracts Views on Vision4Press platform.
Data correspond to usage on the plateform after 2015. The current usage metrics is available 48-96 hours after online publication and is updated daily on week days.
Initial download of the metrics may take a while.