Fig. 6.
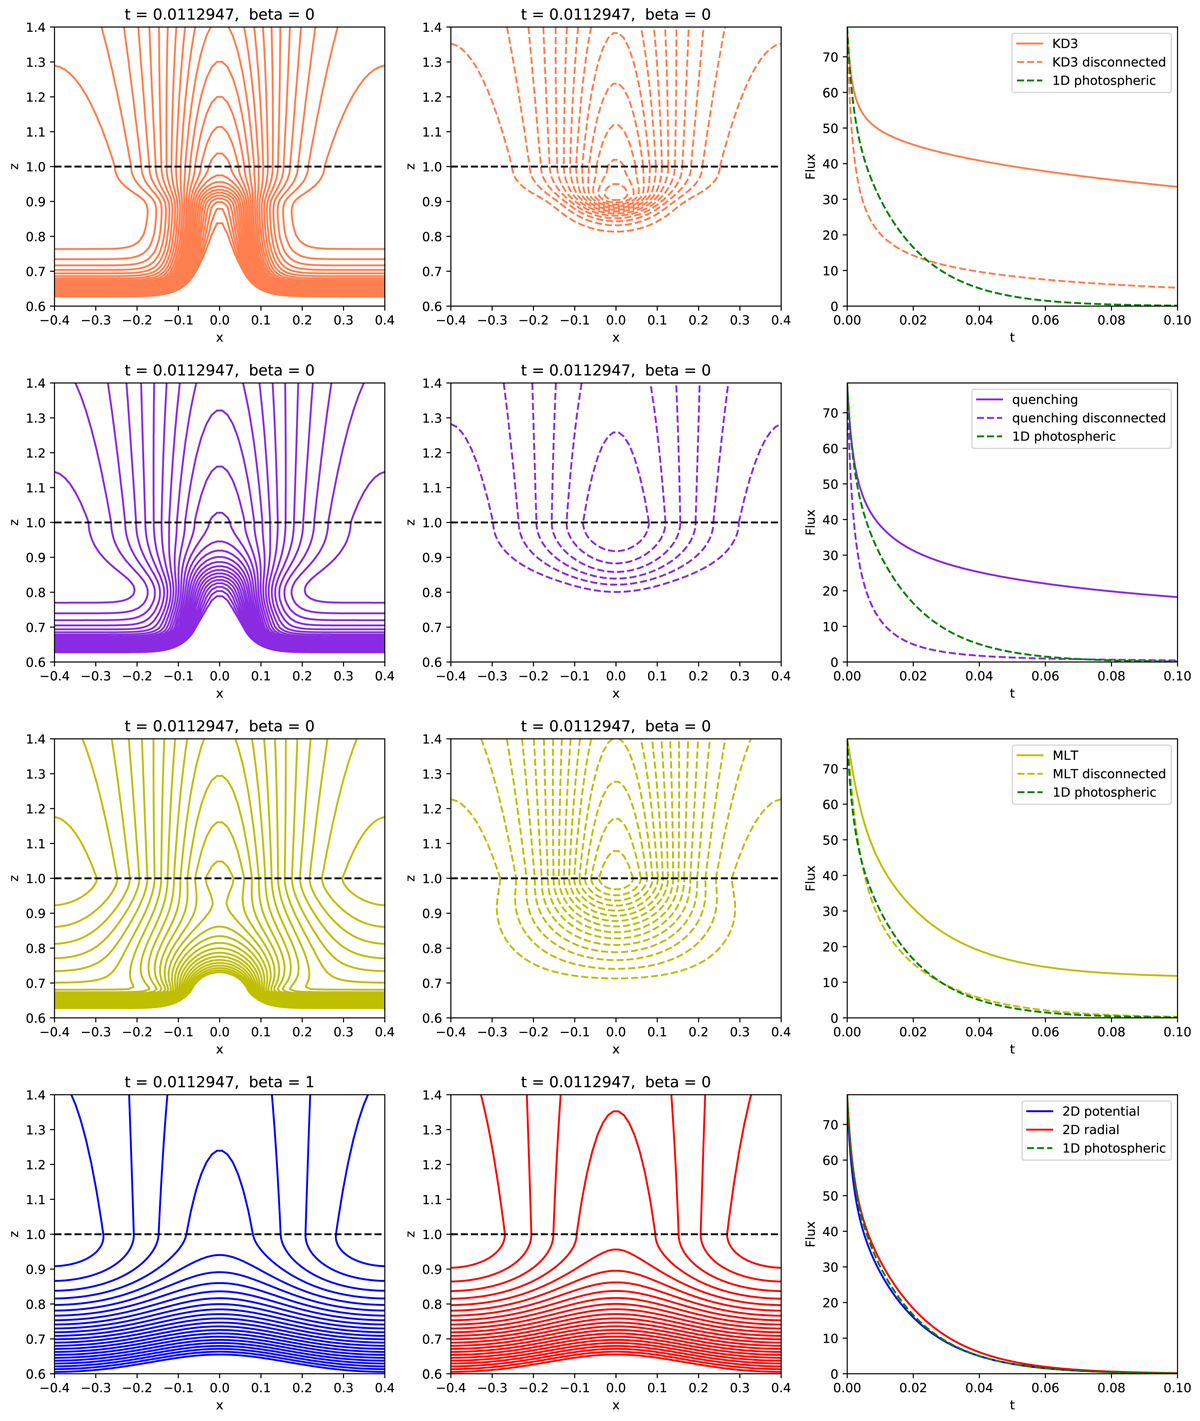
Snapshots of magnetic field lines from simulations using the KD3 (top row), quenching (second row), MLT (third row) and constant (bottom row) diffusion profiles. For the first three profiles, the left-hand column shows the case where the region is connected to the base, and the middle column shows the simulation with a disconnected initial condition. The black dashed line is the top of the domain, above which is shown a potential-field extrapolation. Right-hand column: evolution of magnetic flux at the surface, compared to a 1D surface model (green dashed line). The bottom row (constant η) compares the effects of potential (blue) and radial (red) boundary conditions but using the same connected initial condition.
Current usage metrics show cumulative count of Article Views (full-text article views including HTML views, PDF and ePub downloads, according to the available data) and Abstracts Views on Vision4Press platform.
Data correspond to usage on the plateform after 2015. The current usage metrics is available 48-96 hours after online publication and is updated daily on week days.
Initial download of the metrics may take a while.