Free Access
Fig. 3.
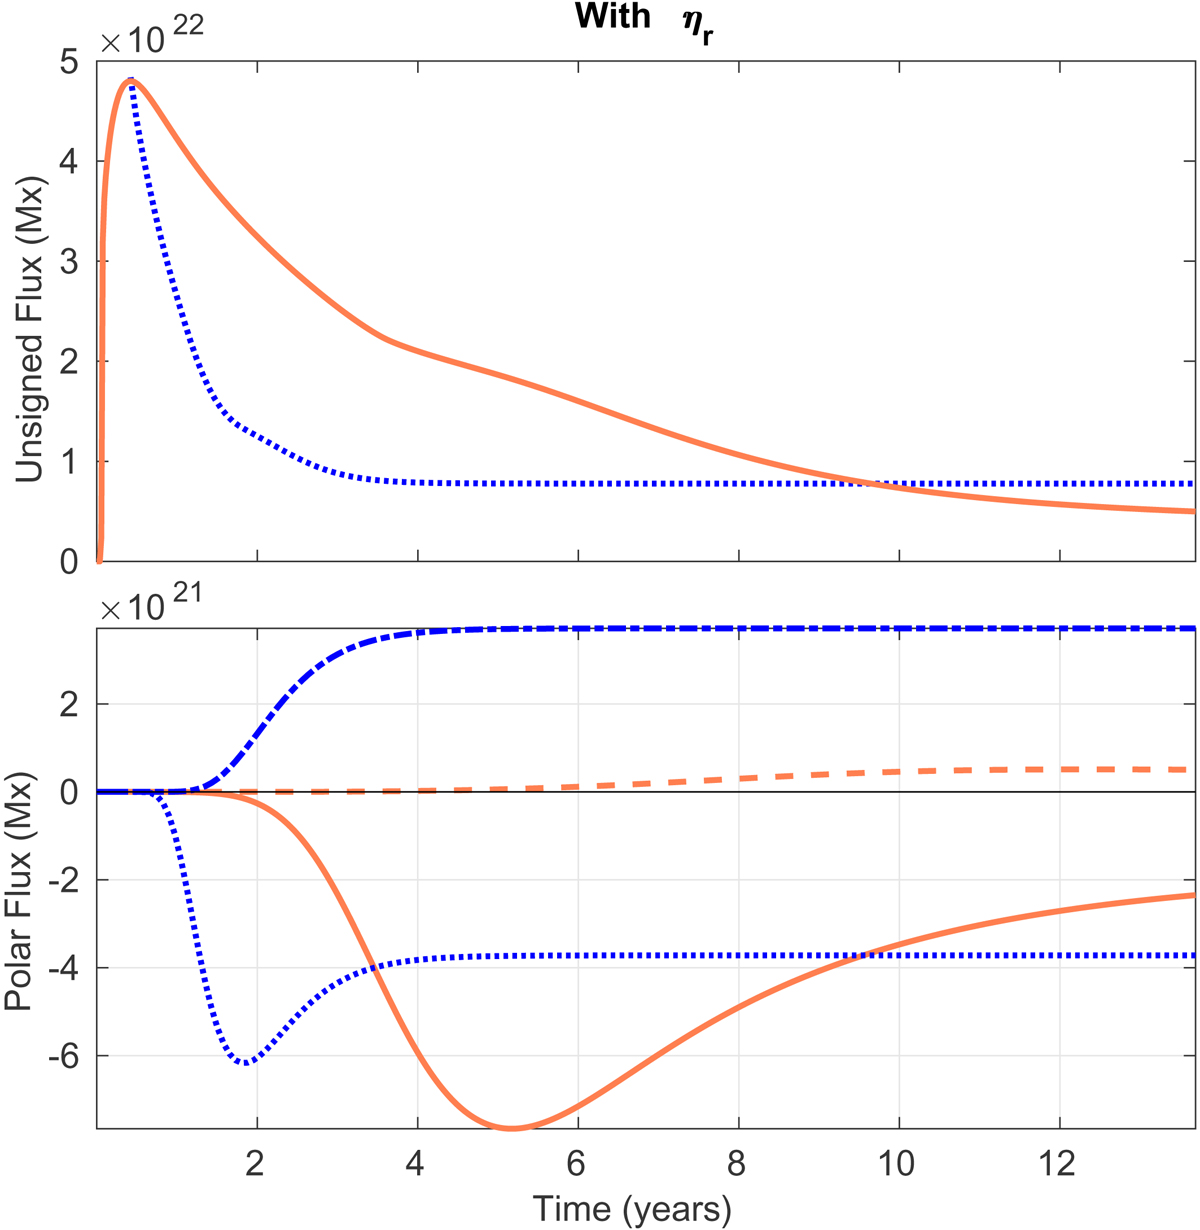
Top: comparison of unsigned surface flux from the 2D SFT simulation (blue) and 3D dynamo simulation (orange). Bottom: comparison of northern (solid and dotted lines) and southern (dashed and dash-dotted) polar flux from the same two simulations, where polar flux is defined as the flux polewards of 70° latitude.
Current usage metrics show cumulative count of Article Views (full-text article views including HTML views, PDF and ePub downloads, according to the available data) and Abstracts Views on Vision4Press platform.
Data correspond to usage on the plateform after 2015. The current usage metrics is available 48-96 hours after online publication and is updated daily on week days.
Initial download of the metrics may take a while.