Free Access
Fig. 8.
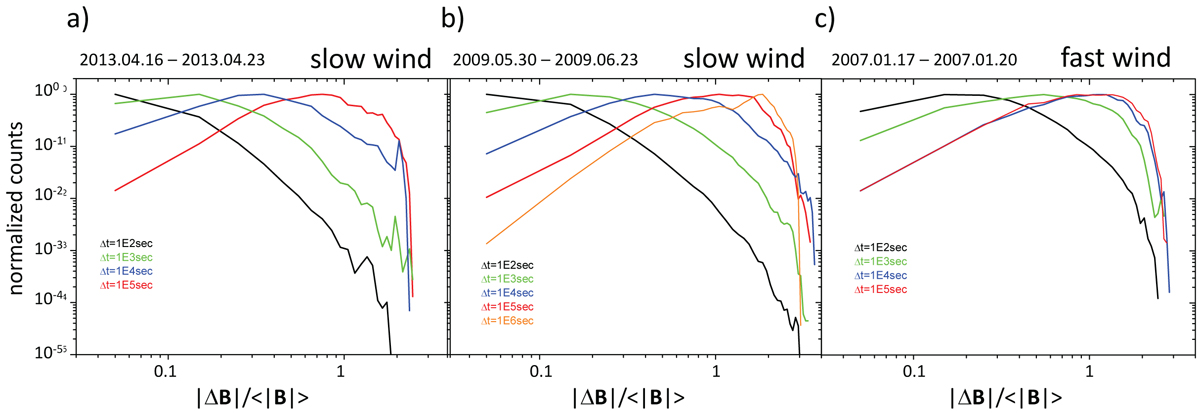
Histograms of the amplitude of the magnetic field fluctuations normalized to the average value of the field intensity within the selected time interval. Each curve corresponds to a different timescale, as indicated by the color-coding, and is normalized to its maximum value.
Current usage metrics show cumulative count of Article Views (full-text article views including HTML views, PDF and ePub downloads, according to the available data) and Abstracts Views on Vision4Press platform.
Data correspond to usage on the plateform after 2015. The current usage metrics is available 48-96 hours after online publication and is updated daily on week days.
Initial download of the metrics may take a while.