Free Access
Fig. 6.
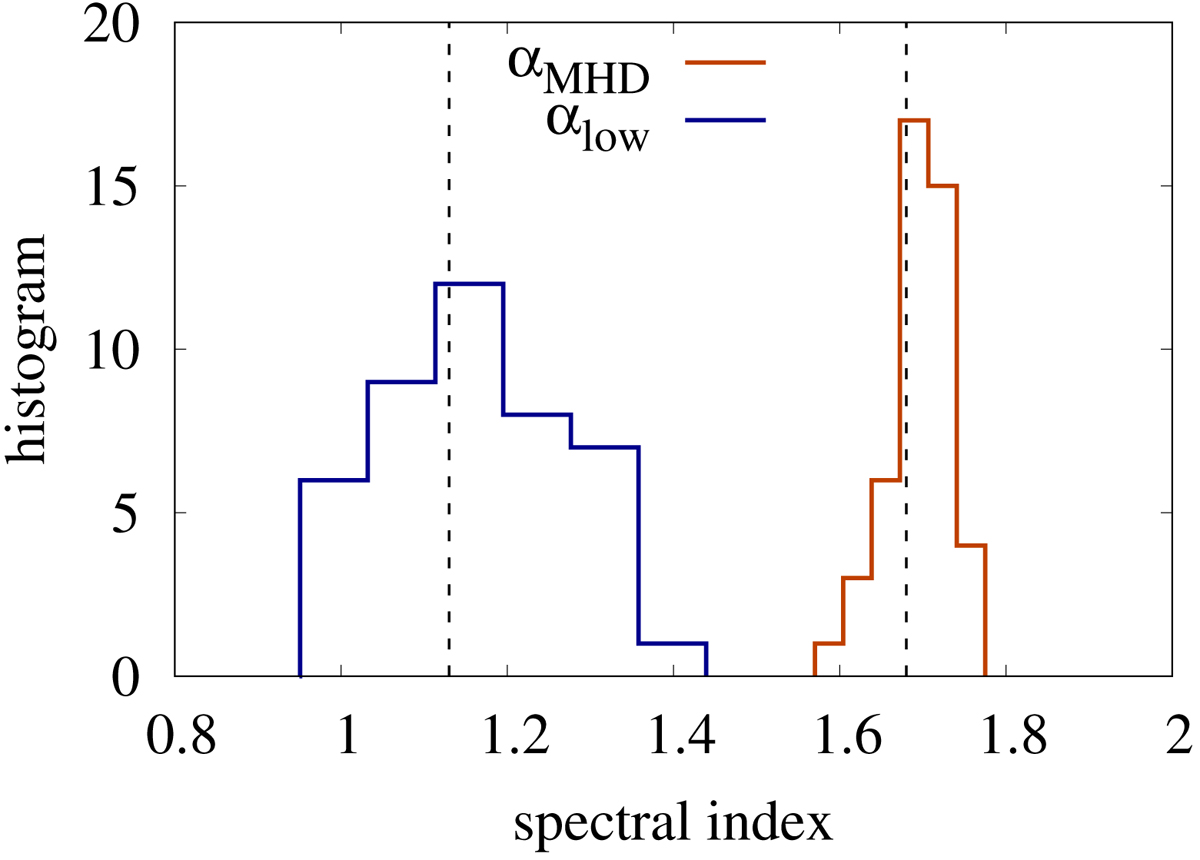
Histograms of the power spectral exponents in the low-frequency (blue) and inertial (dark orange) ranges, as obtained for the 48 slow solar wind intervals measured by Wind and selected for this work. The vertical dashed lines indicate the average within each frequency range.
Current usage metrics show cumulative count of Article Views (full-text article views including HTML views, PDF and ePub downloads, according to the available data) and Abstracts Views on Vision4Press platform.
Data correspond to usage on the plateform after 2015. The current usage metrics is available 48-96 hours after online publication and is updated daily on week days.
Initial download of the metrics may take a while.