Free Access
Fig. 4.
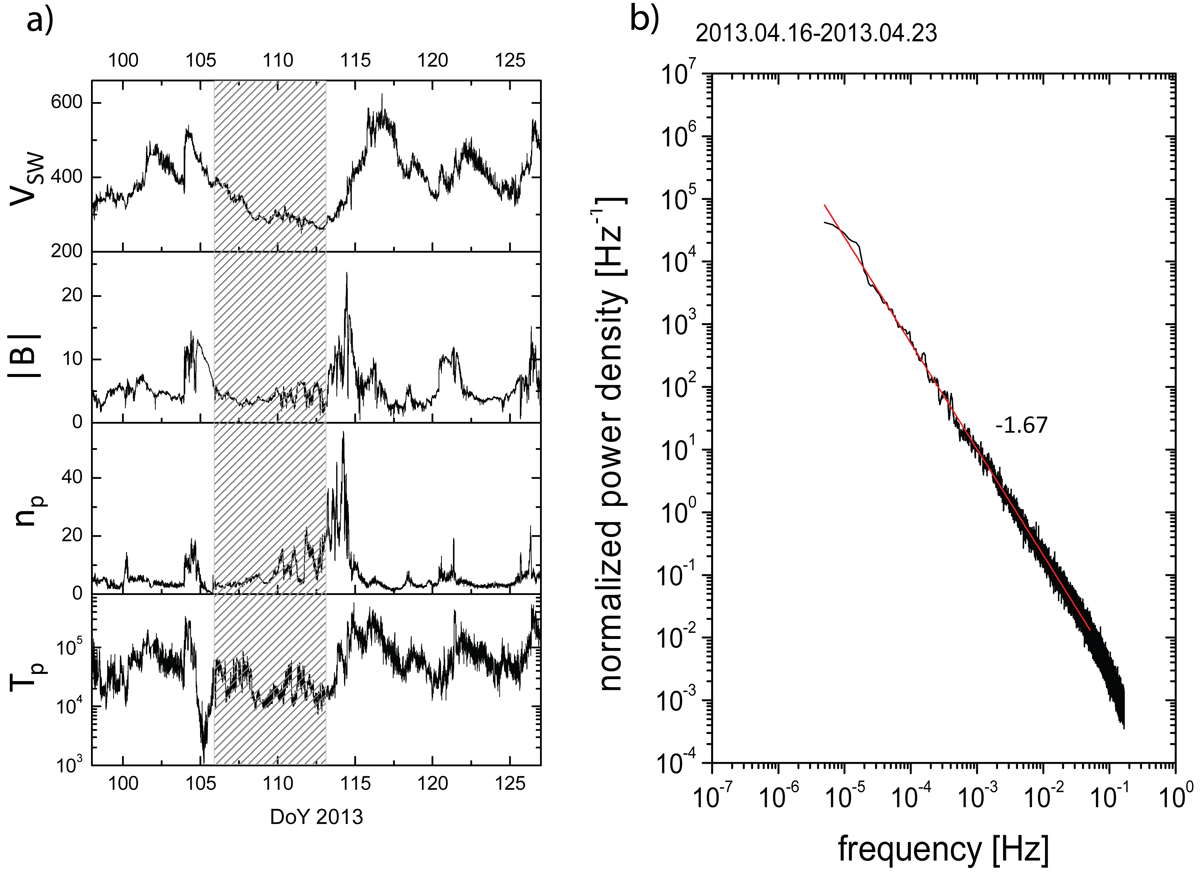
Panel a: one-minute averages of solar wind parameters, for one of the 48 selected slow wind intervals, in the same format as in Fig. 2. Panel b: trace of the power density spectral matrix of magnetic field fluctuations, normalized to the square value of the mean magnetic field intensity, in the same format as in Fig. 2.
Current usage metrics show cumulative count of Article Views (full-text article views including HTML views, PDF and ePub downloads, according to the available data) and Abstracts Views on Vision4Press platform.
Data correspond to usage on the plateform after 2015. The current usage metrics is available 48-96 hours after online publication and is updated daily on week days.
Initial download of the metrics may take a while.