Free Access
Fig. 1.
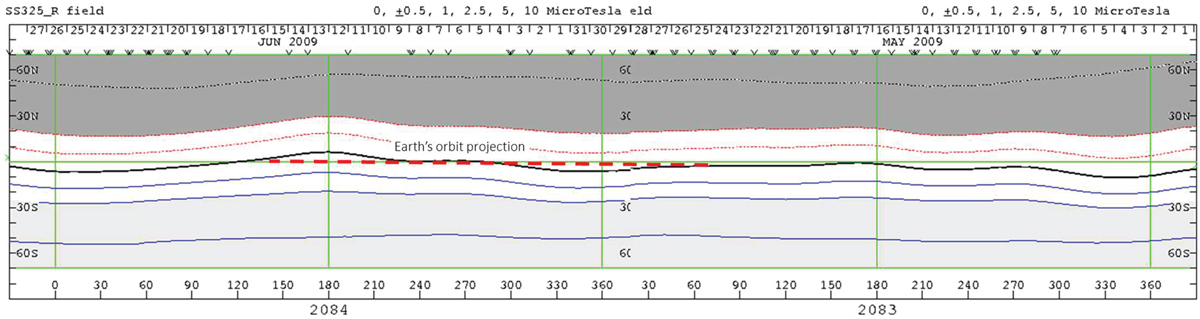
Source surface synoptic maps of Carrington Rotation 2083 and 2084 from Wilcox Solar Observatory as inferred at 3.25 solar radii. Light blue shading shows the positive regions. The neutral line is black. The dashed red line represents the Earth’s orbit back-projected onto the Sun using daily values of solar wind speed.
Current usage metrics show cumulative count of Article Views (full-text article views including HTML views, PDF and ePub downloads, according to the available data) and Abstracts Views on Vision4Press platform.
Data correspond to usage on the plateform after 2015. The current usage metrics is available 48-96 hours after online publication and is updated daily on week days.
Initial download of the metrics may take a while.