Fig. 7.
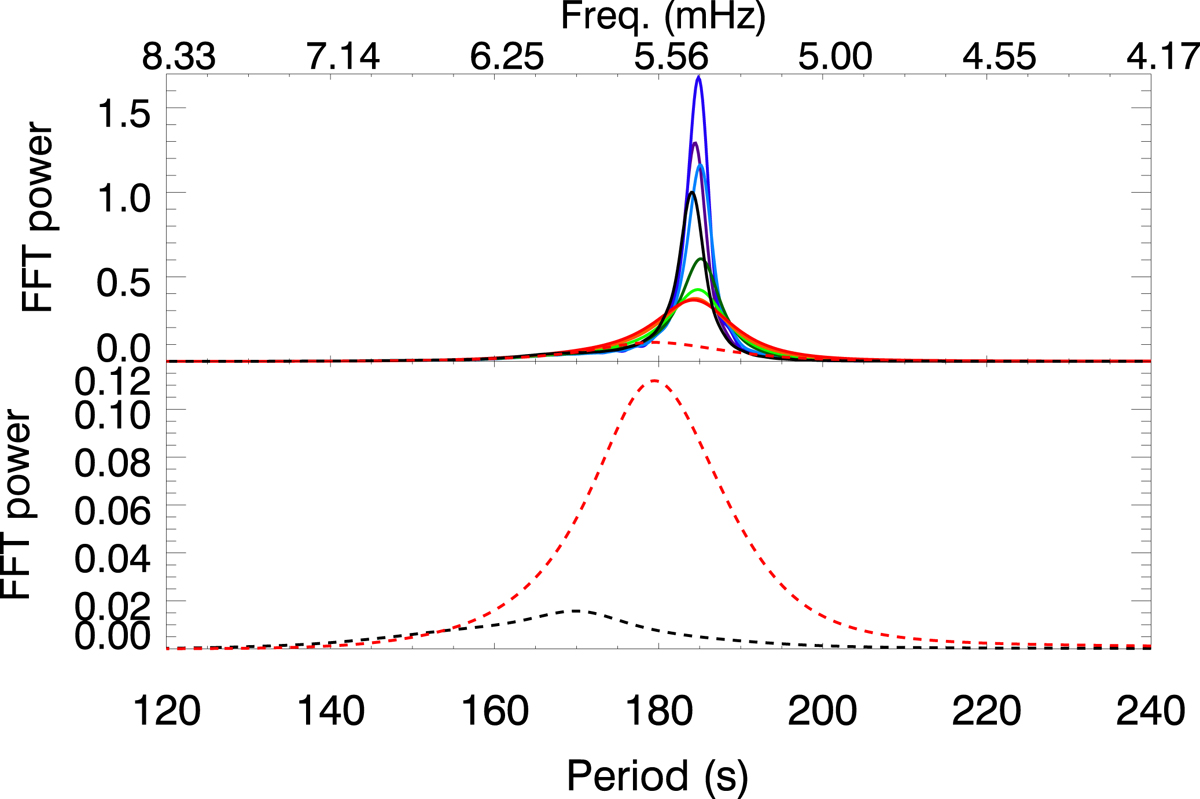
Power spectra of the vertical velocity at z = 1.4 Mm from numerical simulations with waves excited by a broadband driver and various magnetic field strengths. The vertical magnetic field strength is 0 (black line, Simulation 3.4.1), 10 G (violet line, Simulation 3.4.2), 250 G (dark blue, Simulation 3.4.3), 500 G (light blue, Simulation 3.4.4), 1000 G (dark green, Simulation 3.4.5), 1500 G (light green, Simulation 3.4.6), 2000 G (orange, Simulation 3.4.7), and 2500 G (red line, Simulation 3.4.8). Solid lines indicate simulations with the base of the corona located at 2.0 Mm. Dashed lines indicate simulations without transition region or corona, with a vertical magnetic field strength of 0 (black line, bottom panel, 3.4.10) and 2500 G (red lines, both panels, Simulation 3.4.9). All the power spectra are normalized to the same value used for the normalization of the power spectra illustrated in Fig. 6.
Current usage metrics show cumulative count of Article Views (full-text article views including HTML views, PDF and ePub downloads, according to the available data) and Abstracts Views on Vision4Press platform.
Data correspond to usage on the plateform after 2015. The current usage metrics is available 48-96 hours after online publication and is updated daily on week days.
Initial download of the metrics may take a while.