Fig. 6.
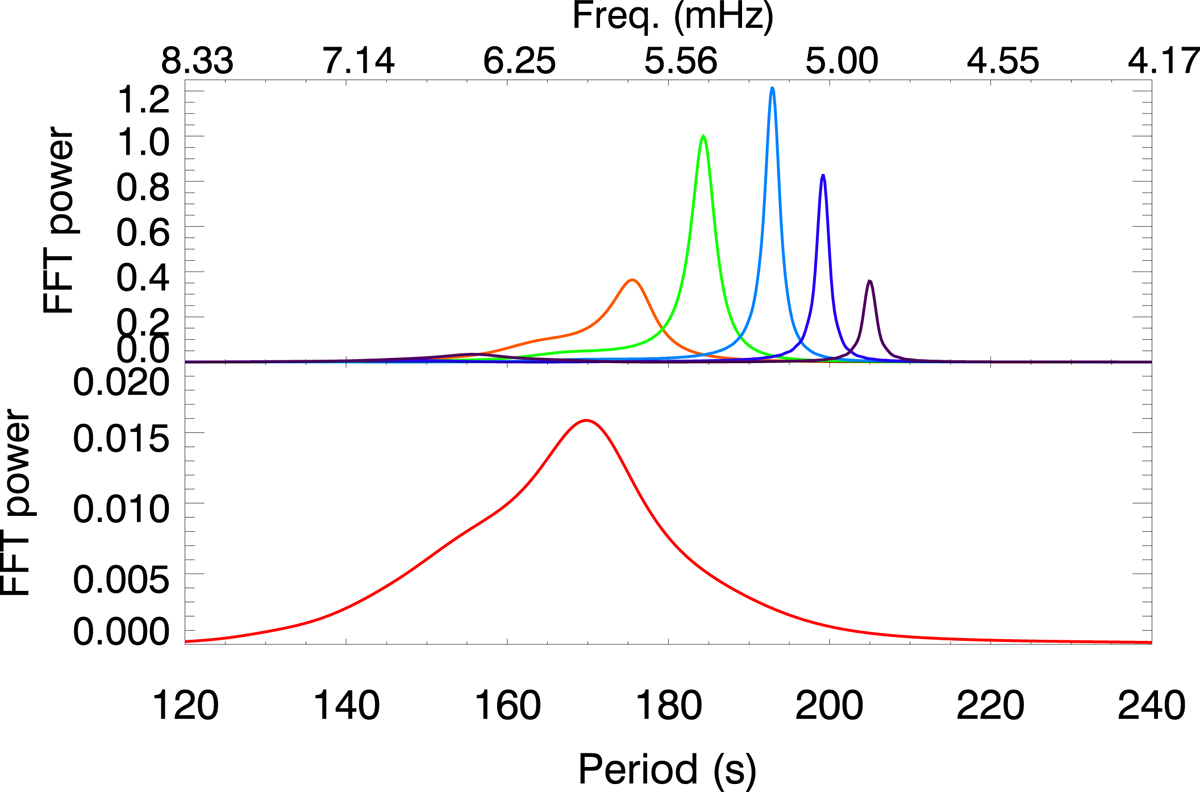
Top panel: power spectra of the vertical velocity at z = 1.4 Mm from numerical simulations with waves excited by a broadband driver and with the base of the corona at different heights. The color code is the same as that in Fig. 1, and the base of the corona is located at 1.8 Mm (orange, Simulation 3.3.1), 2.0 Mm (green, Simulation 3.3.2), 2.2 Mm (light blue, Simulation 3.3.3), 2.4 Mm (dark blue, Simulation 3.3.4), and 2.6 Mm (violet, Simulation 3.3.5). Bottom panel: power spectra of the vertical velocity at z = 1.4 Mm from Simulation 3.3.6 using a broadband driver and without transition region and corona. All the power spectra are normalized to the maximum value of the power from Simulation 3.3.2 (height of the bottom of the corona at 2.0 Mm, nonmagnetic, and without radiative losses).
Current usage metrics show cumulative count of Article Views (full-text article views including HTML views, PDF and ePub downloads, according to the available data) and Abstracts Views on Vision4Press platform.
Data correspond to usage on the plateform after 2015. The current usage metrics is available 48-96 hours after online publication and is updated daily on week days.
Initial download of the metrics may take a while.