Fig. 3.
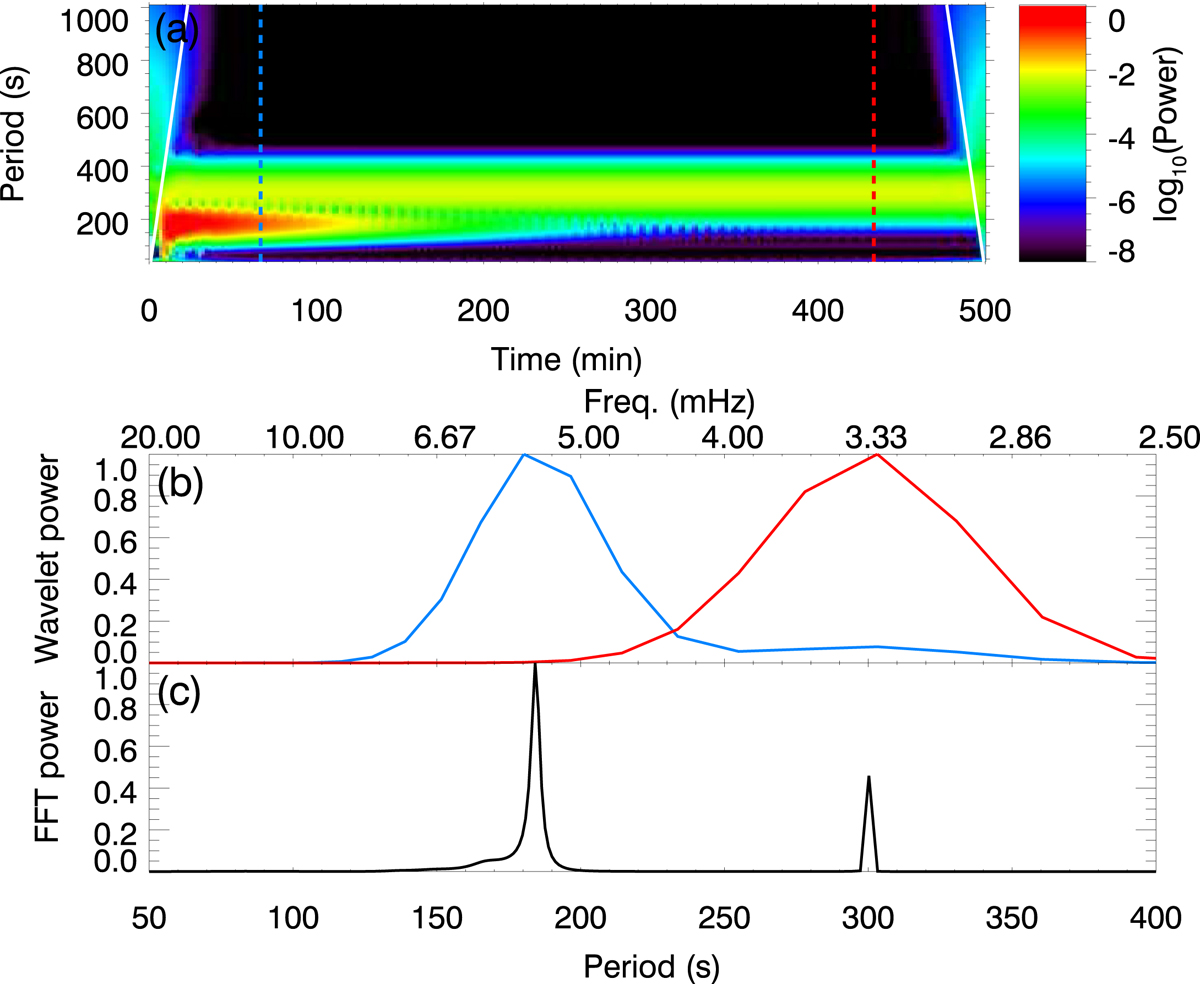
Top panel: power as a function of period (vertical axis) and time (horizontal axis) obtained from the wavelet analysis of the vertical velocity at z = 1.4 Mm from Simulation 3.1.1. The power is normalized and shown in a logarithmic scale. The results are reliable for the region within the two white lines. The vertical dashed lines indicate the time steps plotted in the middle panel. Middle panel: normalized power at t = 67 min (blue line) and at t = 430 min (red line) obtained from the wavelet analysis. Bottom panel: normalized power for the full temporal series (500 min) obtained from the FFT.
Current usage metrics show cumulative count of Article Views (full-text article views including HTML views, PDF and ePub downloads, according to the available data) and Abstracts Views on Vision4Press platform.
Data correspond to usage on the plateform after 2015. The current usage metrics is available 48-96 hours after online publication and is updated daily on week days.
Initial download of the metrics may take a while.