Fig. 10.
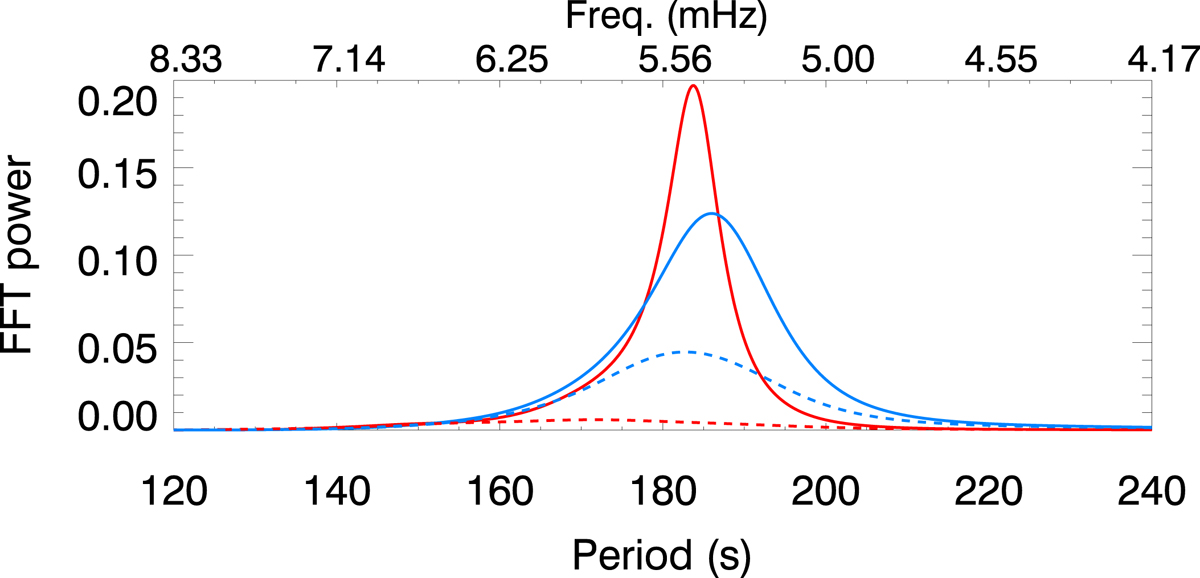
Power spectra of the vertical velocity at z = 1.4 Mm from numerical simulations with the photospheric radiative losses estimated from Spiegel (1957). Red lines correspond to cases with the magnetic field set to zero, and blue lines to a magnetic field strength of 2500 G. Solid lines represent the cases with the base of the corona located at z = 2.0 Mm, and dashed lines to cases without a corona or transition region. All the power spectra are normalized to the same value used for the normalization of the power spectra illustrated in Fig. 6.
Current usage metrics show cumulative count of Article Views (full-text article views including HTML views, PDF and ePub downloads, according to the available data) and Abstracts Views on Vision4Press platform.
Data correspond to usage on the plateform after 2015. The current usage metrics is available 48-96 hours after online publication and is updated daily on week days.
Initial download of the metrics may take a while.