Fig. 9.
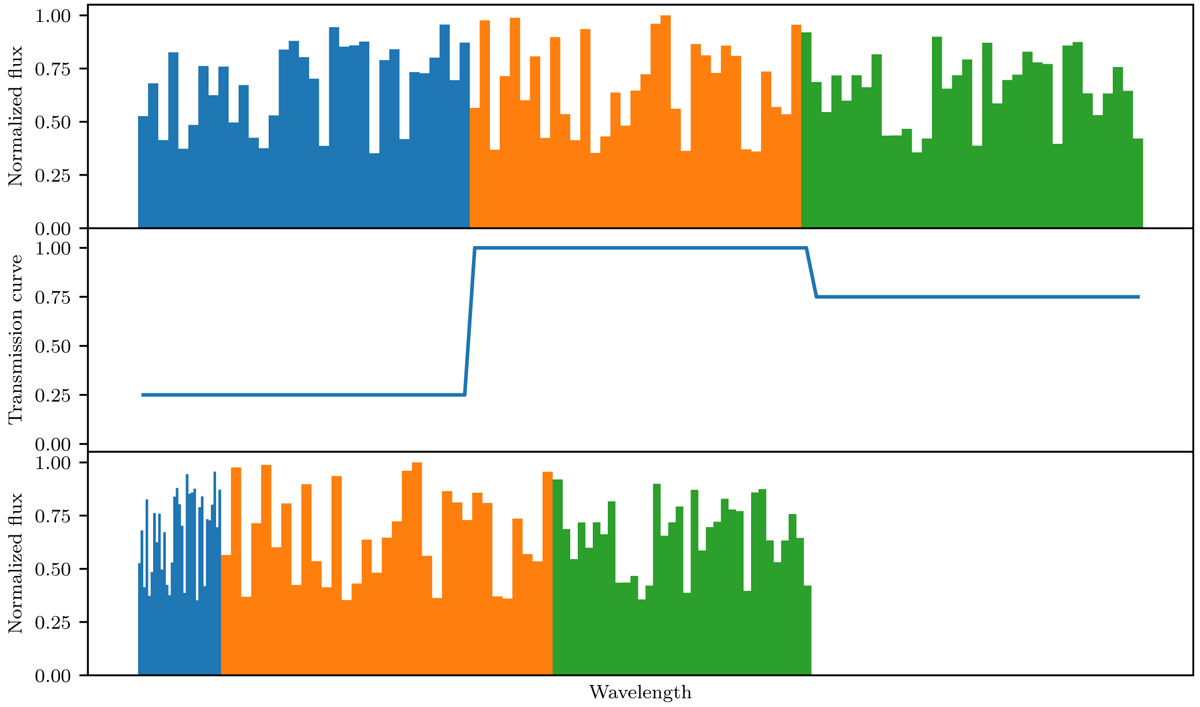
Illustration of the wavelength transformation according to Eq. (3). Upper panel: schematic representation of flux dependence on wavelengths. Middle panel: exemplary step-wise transmission curve. Lower panel: resulting detailed flux on a transformed wavelength grid. Colors indicate to which of the three values of the transmission curve the fluxes are associated to.
Current usage metrics show cumulative count of Article Views (full-text article views including HTML views, PDF and ePub downloads, according to the available data) and Abstracts Views on Vision4Press platform.
Data correspond to usage on the plateform after 2015. The current usage metrics is available 48-96 hours after online publication and is updated daily on week days.
Initial download of the metrics may take a while.