Fig. 9.
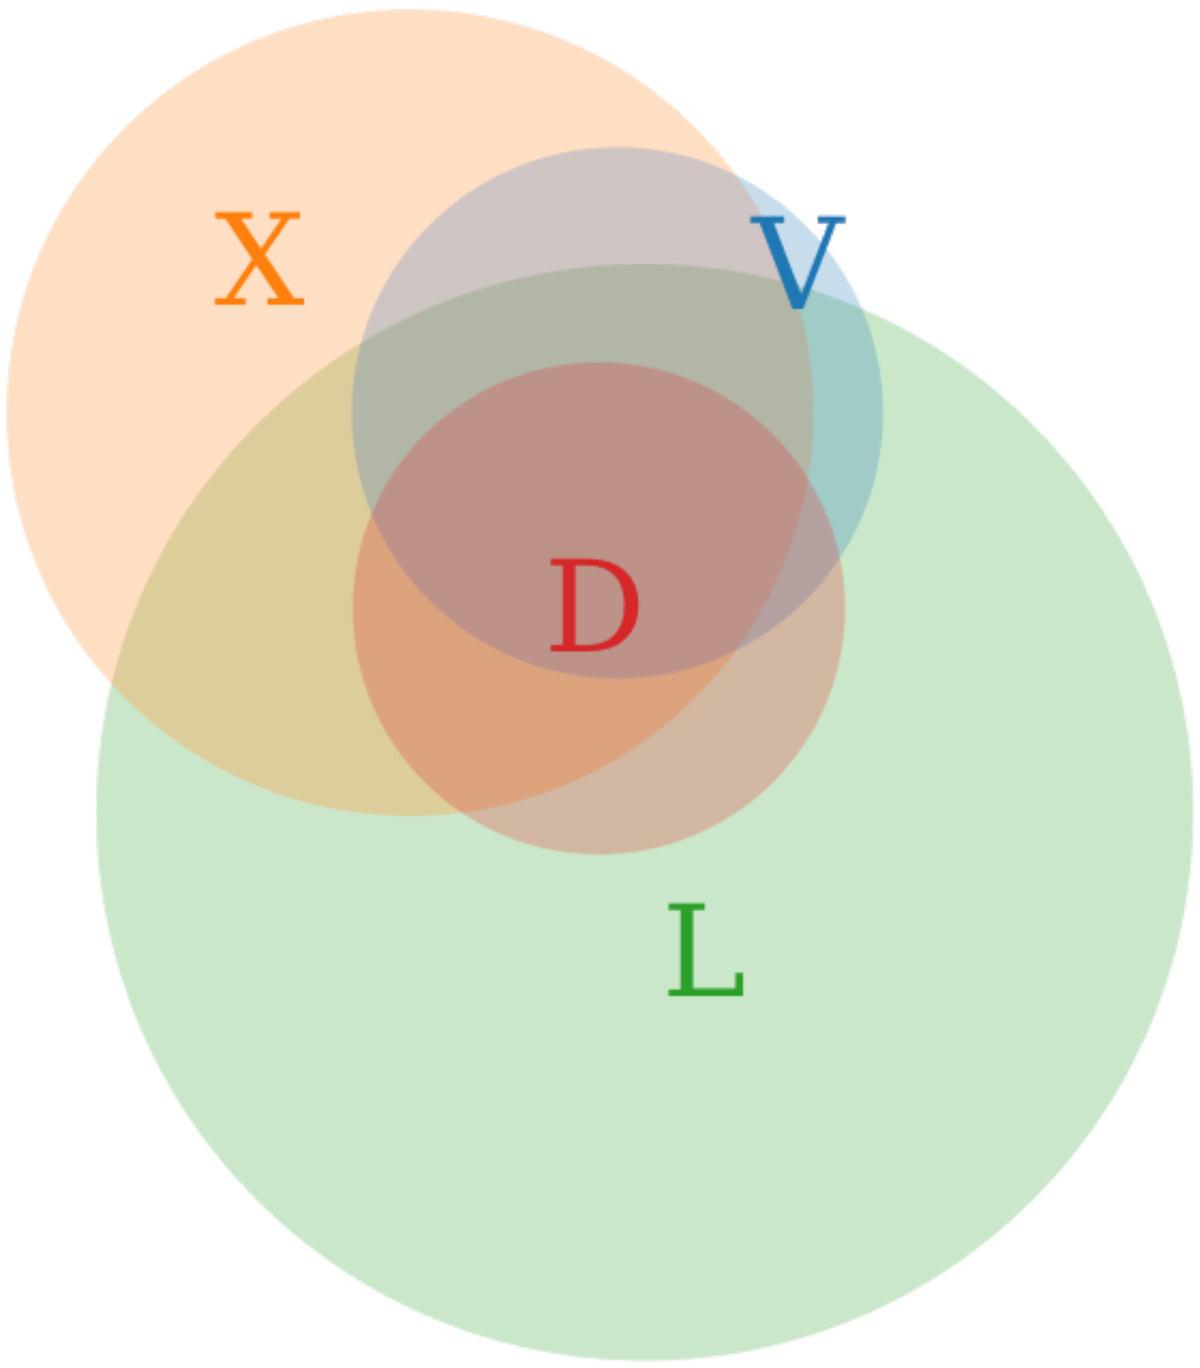
Venn diagram combining the samples of AGN selected by means of different diagnostics: optical variability (V), X-ray properties (X, from the X/O diagram), Lacy region (L), and Donley region (D). The circle sizes, as well as the overlap sizes, are quantitatively correct. The sample of optically variable sources includes the 34 sources that are not confirmed by any other diagnostics, while it does not include the 9 sources that are confirmed as stars (see main text). It is apparent that the variability-selected sample largely overlaps the X-ray selected and the Lacy-selected AGN, while the overlap with the Donley-selected sample is only partial.
Current usage metrics show cumulative count of Article Views (full-text article views including HTML views, PDF and ePub downloads, according to the available data) and Abstracts Views on Vision4Press platform.
Data correspond to usage on the plateform after 2015. The current usage metrics is available 48-96 hours after online publication and is updated daily on week days.
Initial download of the metrics may take a while.