Fig. 8.
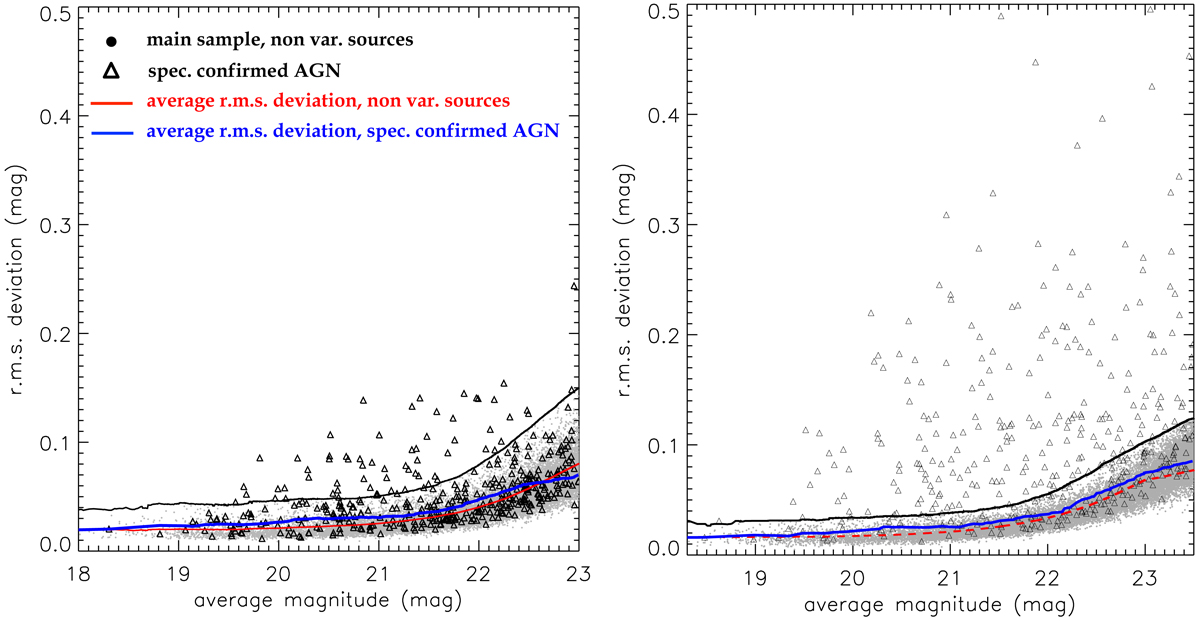
Light curve r.m.s. as a function of the average magnitude for all the non-variable sources in the main sample (small dots) and for those with an X-ray counterpart and that are spectroscopically confirmed to be AGN (triangles), from our five month analysis (De Cicco et al. 2015, left panel) and the present analysis (right panel). In the left panel the vertical axis has been rescaled to the one in the right panel, while magnitudes are limited to r(AB) ≤ 23 mag. The red and blue curves represent the running average of the r.m.s. deviation for the two subsamples of sources, respectively. In the present work we find 59% of the sources in the second subsample above the variability threshold (black line), while they were only 15% in our former analysis.
Current usage metrics show cumulative count of Article Views (full-text article views including HTML views, PDF and ePub downloads, according to the available data) and Abstracts Views on Vision4Press platform.
Data correspond to usage on the plateform after 2015. The current usage metrics is available 48-96 hours after online publication and is updated daily on week days.
Initial download of the metrics may take a while.