Fig. 7.
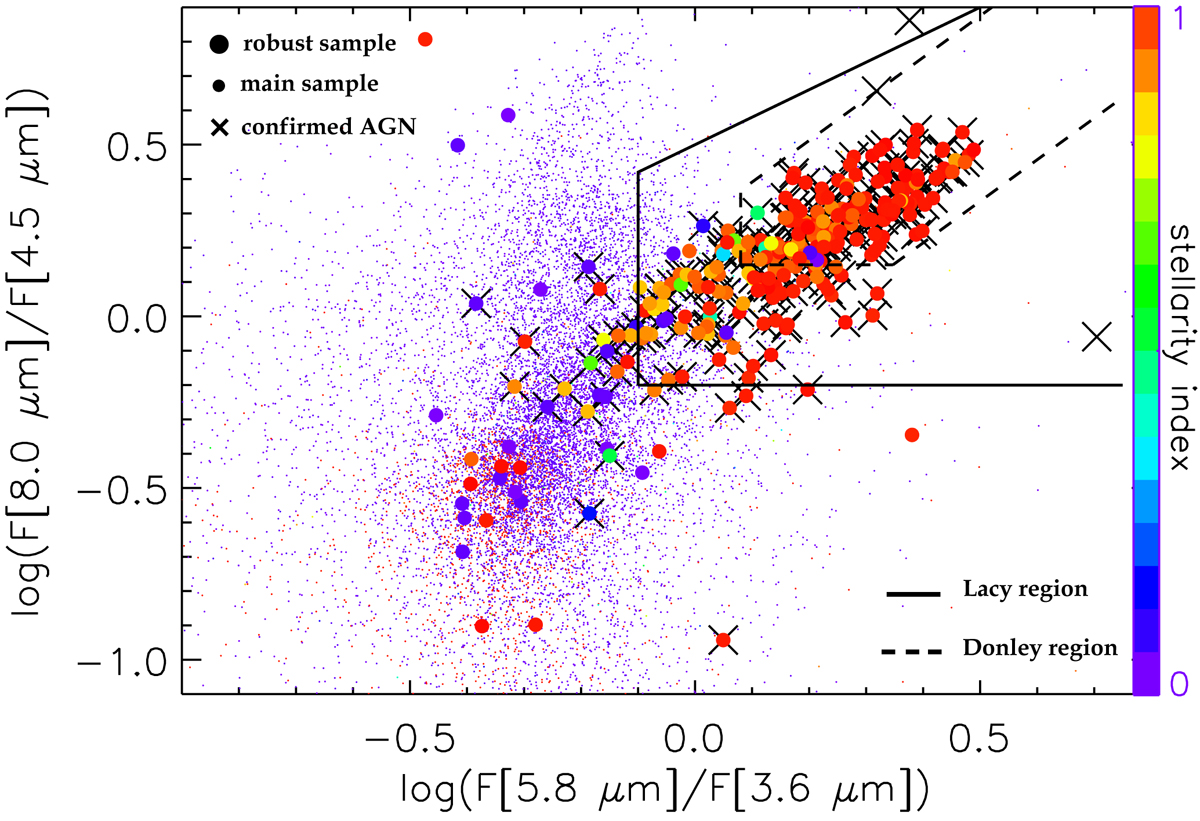
MIR diagram where colors are obtained as ratios of the fluxes in the four IRAC channels. Symbols are identical to Fig. 6. The solid lines delineate the region where AGN are typically found according to Lacy et al. (2007), while the dashed lines define the less contaminated AGN region identified in Donley et al. (2012). A blob characterized by a high concentration of stars can be seen in the lower left part of the diagram, while inactive galaxies tend to occupy the roughly vertical, scattered sequence defined by small violet dots.
Current usage metrics show cumulative count of Article Views (full-text article views including HTML views, PDF and ePub downloads, according to the available data) and Abstracts Views on Vision4Press platform.
Data correspond to usage on the plateform after 2015. The current usage metrics is available 48-96 hours after online publication and is updated daily on week days.
Initial download of the metrics may take a while.