Fig. 6.
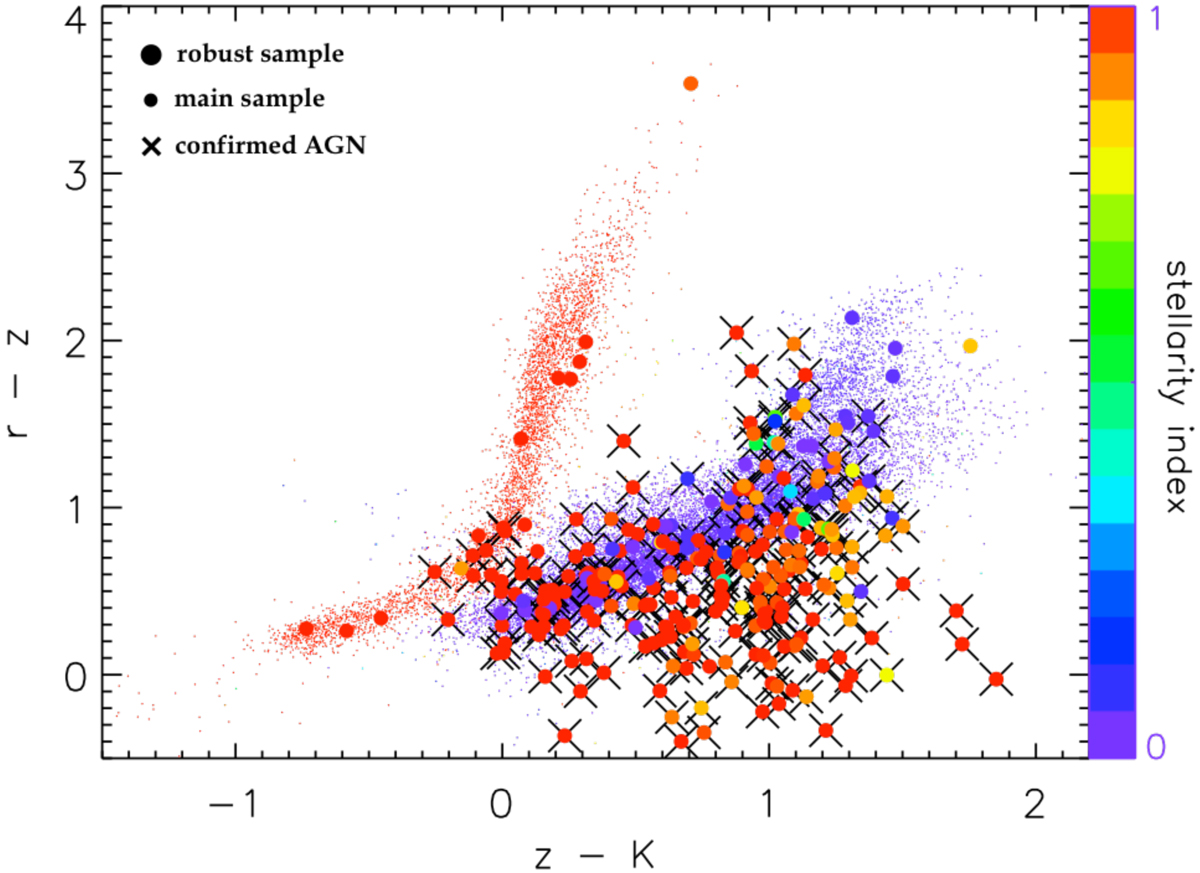
r − z vs. z − K diagram for 296 out of 299 AGN candidates in the robust sample (large dots) for which r, z, K magnitudes and stellarity index are available. Small dots represent all the objects detected in the VST-COSMOS field for which HST stellarity indices and optical/NIR color information are available, and are shown as a reference population. Both large and small dots are color-coded according to their stellarity index (right vertical axis). Crosses indicate X-ray emitting variable AGN candidates confirmed by their X-ray properties. It is apparent that the small dots in the plot define two distinct loci: one for stars (red), and one for galaxies (violet). A third class of objects, i.e., quasar-like AGN, is identified from the large dots, corresponding to sources approximately near or below the galaxy locus but mostly with stellarity indices typical of compact sources. Approximately 6% of the main sample sources shown in Fig. 6 are located in this AGN locus, but are not part of our robust sample of AGN candidates as they are below the variability threshold in the diagram shown in Fig. 3. None of these sources has an X-ray counterpart in the X-ray sample, and 96% of them are extended sources based on their stellarity. Ks magnitudes are taken from McCracken et al. (2010).
Current usage metrics show cumulative count of Article Views (full-text article views including HTML views, PDF and ePub downloads, according to the available data) and Abstracts Views on Vision4Press platform.
Data correspond to usage on the plateform after 2015. The current usage metrics is available 48-96 hours after online publication and is updated daily on week days.
Initial download of the metrics may take a while.