Fig. 4.
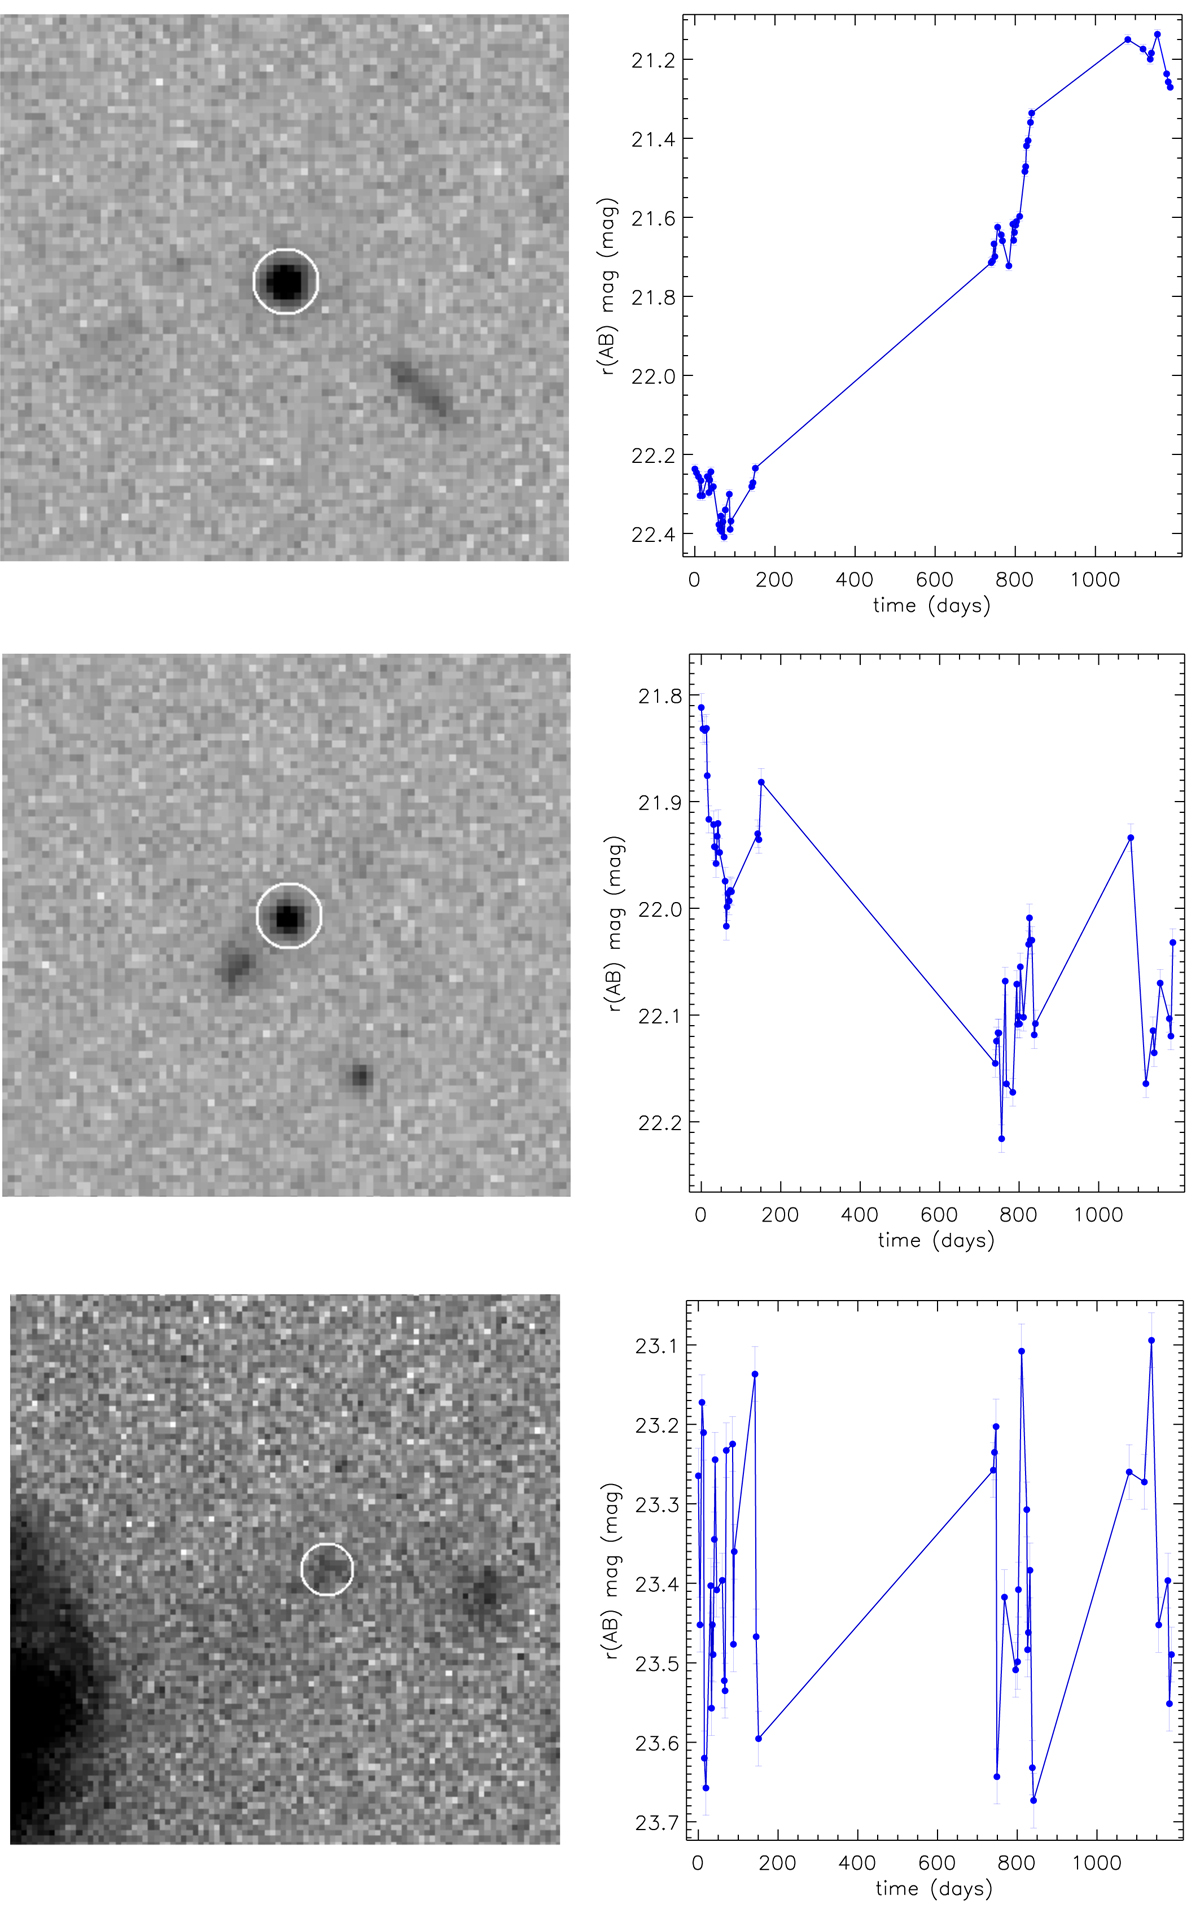
Examples of variable AGN candidates assigned to different quality classes, with corresponding light curves. The images in the upper and middle panel are from visit 49, which has the second-best seeing; the image in the lower panel is from visit 33, which has the poorest seeing. White circles correspond to the 2″ diameter aperture and are centered on the average object coordinates. Objects labeled 1 (upper panel) are generally isolated and free from aesthetic defects. For objects belonging to class 2 (middle panel), potential problems (e.g., the presence of a neighbor) must be taken into account. Objects labeled 3 (lower panel) are probably spurious variable sources. The case of a source lying in the halo of an extended and bright neighbor (on the far left) is shown as an example: from the corresponding light curve, we can see that its erratic variability, well in excess of the photometric error, is likely due to an incorrect subtraction of the variable background because of the bright neighbor. The error bars for each source are defined as the 95% uncertainty on the source magnitude.
Current usage metrics show cumulative count of Article Views (full-text article views including HTML views, PDF and ePub downloads, according to the available data) and Abstracts Views on Vision4Press platform.
Data correspond to usage on the plateform after 2015. The current usage metrics is available 48-96 hours after online publication and is updated daily on week days.
Initial download of the metrics may take a while.