Fig. 5.
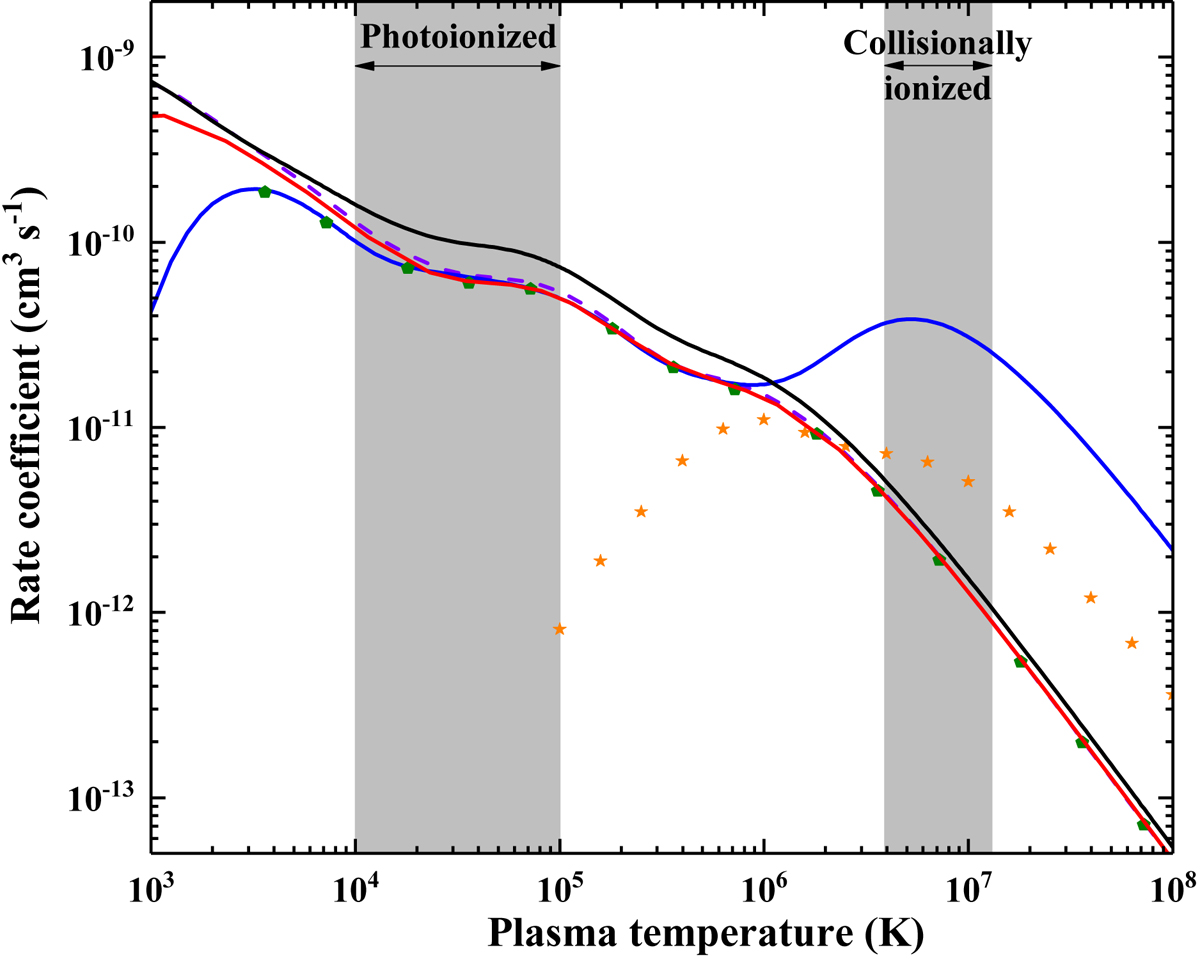
Experimentally derived plasma recombination rate coefficients (black solid line) compared with the present and previous calculated data. The red solid line is the plasma rate coefficients derived from the presently calculated DR rate coefficients, the violet dashed line is the calculated data by Gu (2003), the blue solid line denotes the calculation by Zatsarinny et al. (2006) with the AUTOSTRUCTURE code, the orange stars are the previous recommended DR data (Jacobs et al. 1980), and the green pentagons are the data from the Open-ADAS website.
Current usage metrics show cumulative count of Article Views (full-text article views including HTML views, PDF and ePub downloads, according to the available data) and Abstracts Views on Vision4Press platform.
Data correspond to usage on the plateform after 2015. The current usage metrics is available 48-96 hours after online publication and is updated daily on week days.
Initial download of the metrics may take a while.