Free Access
Fig. 3.
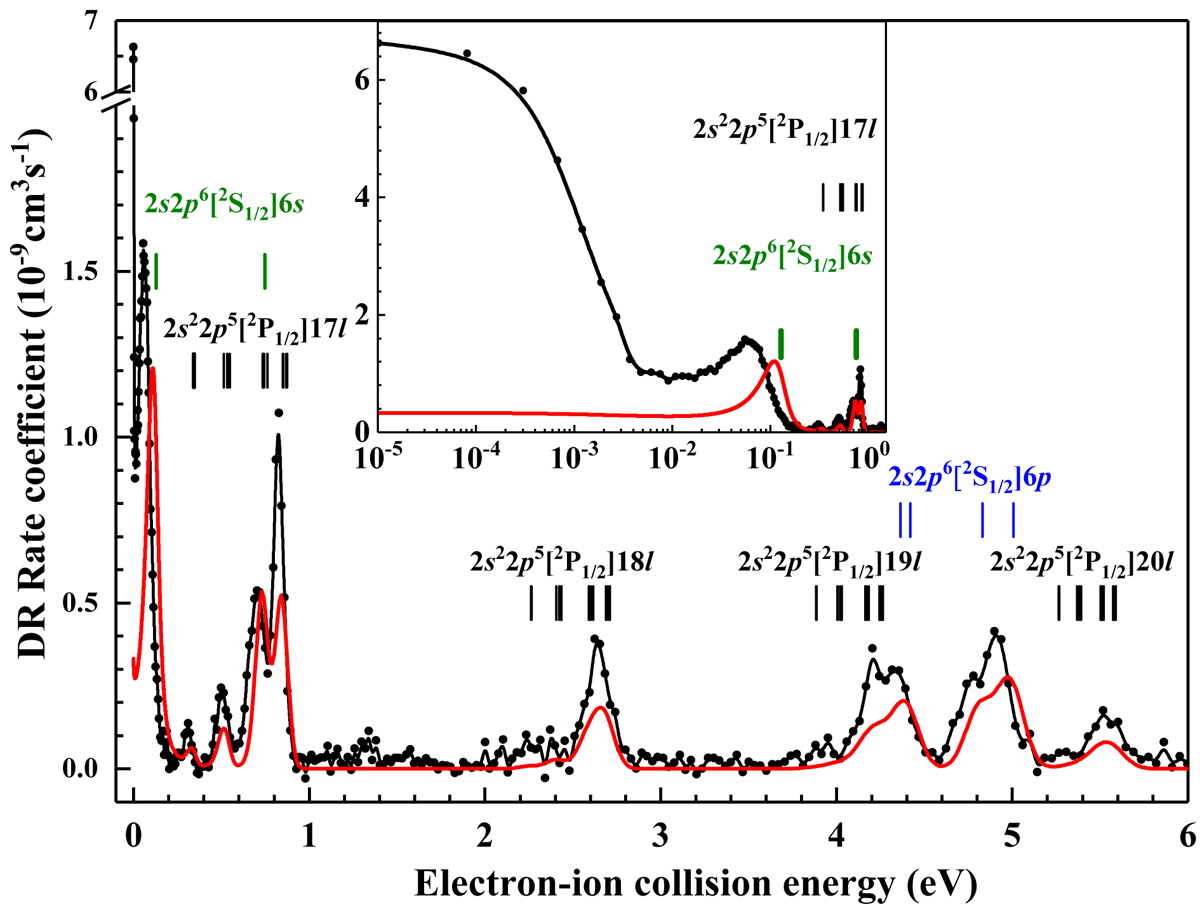
Detailed comparison between the measured spectrum (black dot-connected line) and the theoretical spectrum calculated by FAC (red solid line). The vertical bars denote the calculated resonance positions of the corresponding intermediate states.
Current usage metrics show cumulative count of Article Views (full-text article views including HTML views, PDF and ePub downloads, according to the available data) and Abstracts Views on Vision4Press platform.
Data correspond to usage on the plateform after 2015. The current usage metrics is available 48-96 hours after online publication and is updated daily on week days.
Initial download of the metrics may take a while.