Fig. 2.
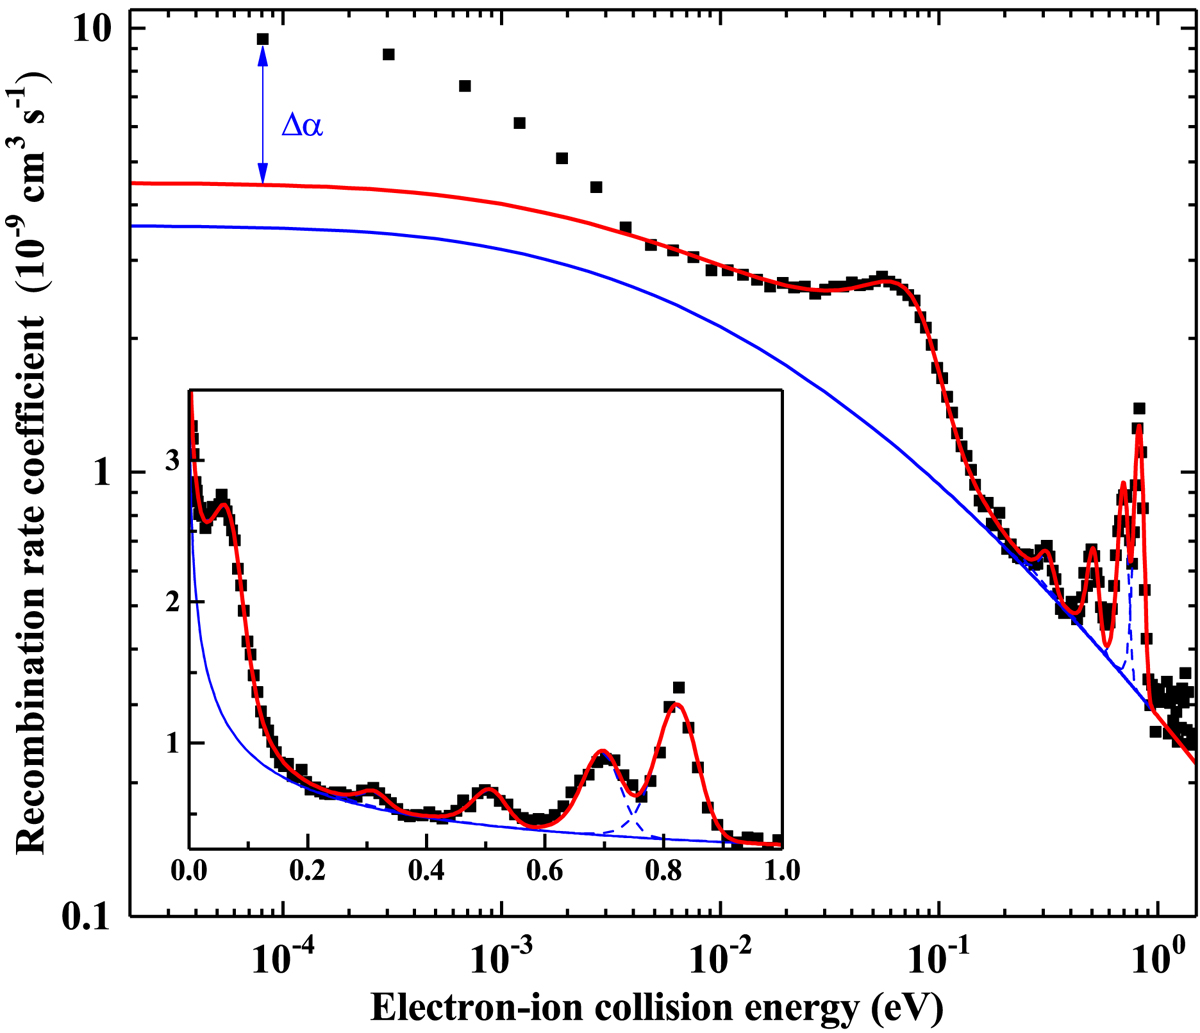
Fitted curve (red solid line) of the measured DR spectrum below 1.2 eV. The blue solid line indicates the fitted RR background and the blue dashed lines depict the line shape of each single peak. The fitted parallel and perpendicular electron temperatures are kBT∥ = 0.56(0.05) meV and kBT⊥ = 23(1) meV, respectively. Δα denotes the recombination rate enhancement at very low energies (below 100 meV) which is the artifact of the merged-beam method (Gwinner et al. 2000).
Current usage metrics show cumulative count of Article Views (full-text article views including HTML views, PDF and ePub downloads, according to the available data) and Abstracts Views on Vision4Press platform.
Data correspond to usage on the plateform after 2015. The current usage metrics is available 48-96 hours after online publication and is updated daily on week days.
Initial download of the metrics may take a while.