Fig. 1.
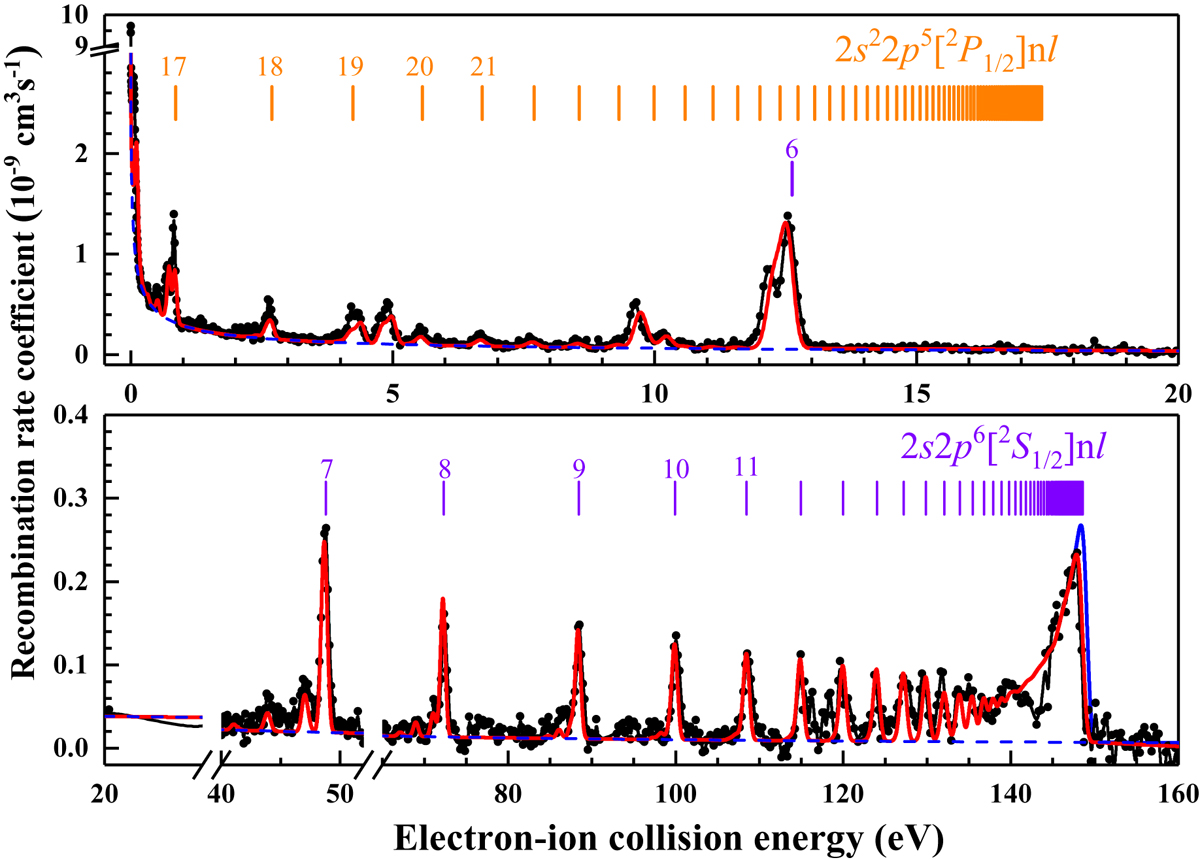
Measured and calculated recombination rate coefficients of F-like Ni. The experimental result (connected filled circles) covers the energy range of 0–160 eV. The red solid line denotes the theoretically calculated recombination spectrum and the blue dashed line shows the RR background. The vertical bars are the resonance positions of ![]() and
and ![]() series estimated by the Rydberg formula. The blue solid line accounts for the theoretical DR rate coefficients of the captured electron with principal quantum number up to nmax = 1000.
series estimated by the Rydberg formula. The blue solid line accounts for the theoretical DR rate coefficients of the captured electron with principal quantum number up to nmax = 1000.
Current usage metrics show cumulative count of Article Views (full-text article views including HTML views, PDF and ePub downloads, according to the available data) and Abstracts Views on Vision4Press platform.
Data correspond to usage on the plateform after 2015. The current usage metrics is available 48-96 hours after online publication and is updated daily on week days.
Initial download of the metrics may take a while.