Fig. 4
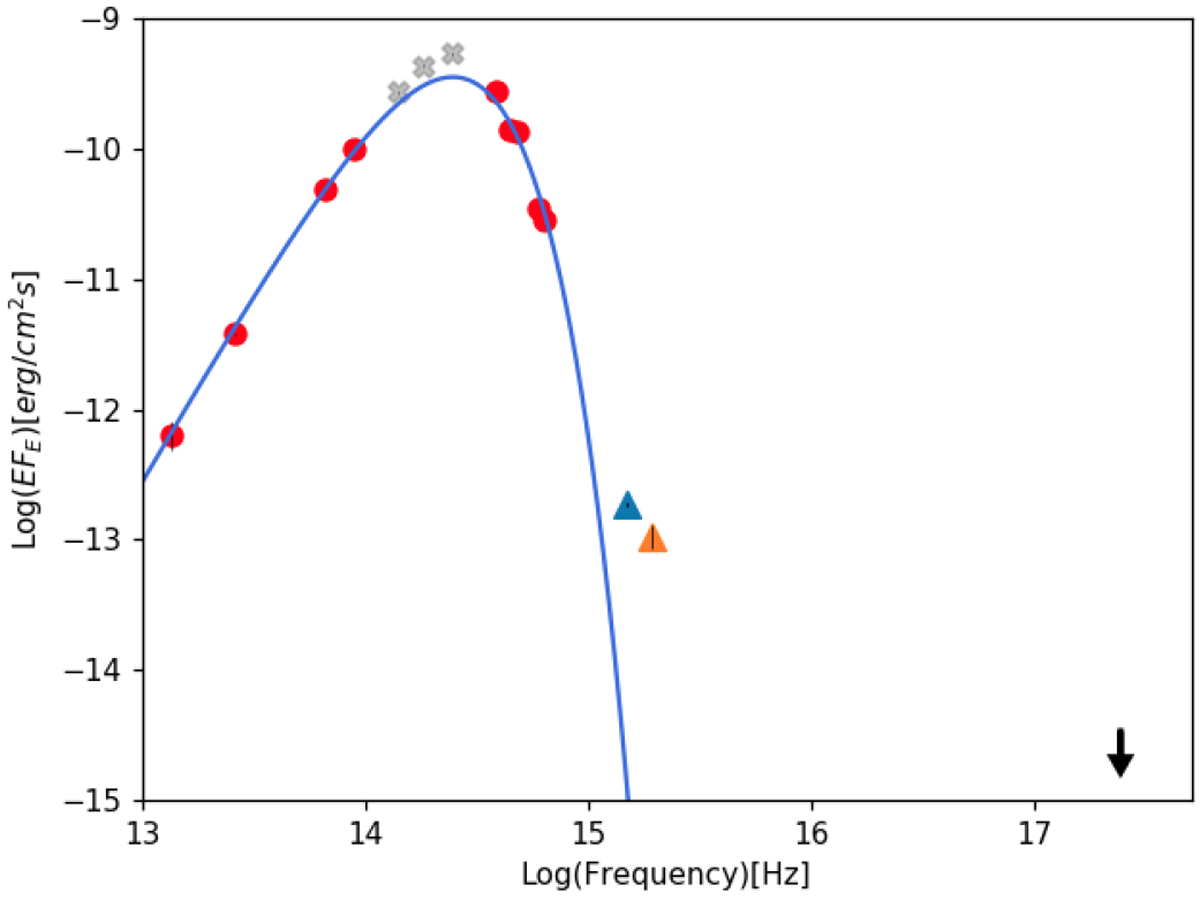
LHS 1140 EFE SED, calculated with data from the CDS. The points are listed in Table 2. Red points mark the black-body temperature estimation. Gray symbols are 2MASS data. UVOT UVW2 NUV flux is represented by the blue triangle. FUVG flux estimated with FUVG −NUVG correlation is represented by the orange triangle. The black arrow shows the 3σ upper limit to the X-ray flux of LHS 1140 at 1 keV. The blue line is the black body model with a temperature of 3015 K.
Current usage metrics show cumulative count of Article Views (full-text article views including HTML views, PDF and ePub downloads, according to the available data) and Abstracts Views on Vision4Press platform.
Data correspond to usage on the plateform after 2015. The current usage metrics is available 48-96 hours after online publication and is updated daily on week days.
Initial download of the metrics may take a while.