Fig. A.1.
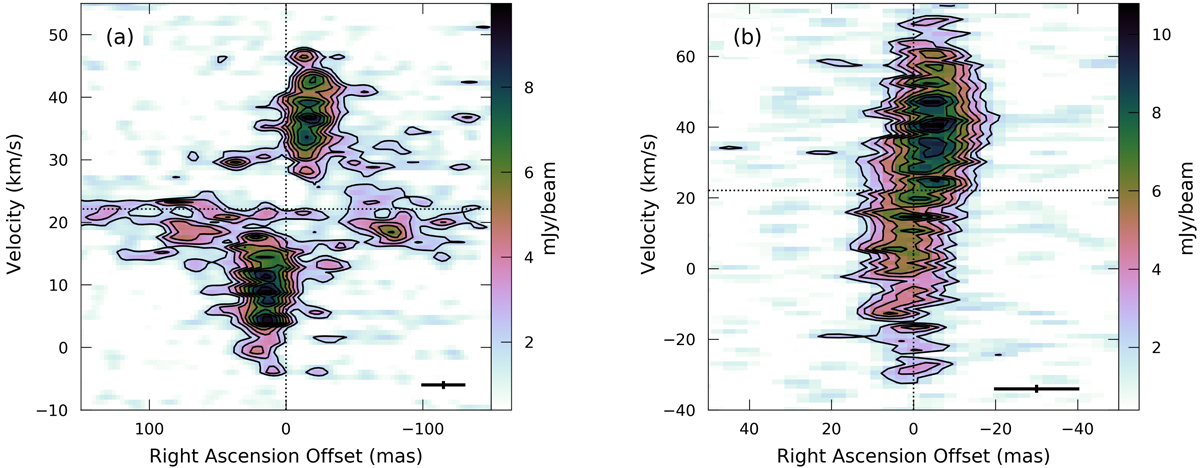
Panel a: PV diagram for SiO (5-4) emission taken using the same cut PA and width as for the H2O presented in Fig.2b, a 5 pixel-wide slice along the dashed line at PA = 25.9°. The resolution is shown at the bottom right as the beam major axis (30 mas) and the velocity resolution (0.8 km s−1). The inner structure from −50 to +50 mas overlaps that of the H2O emission, although we see emission extend past ±50 mas (110 au) at low velocities (cf. Maud et al. 2018). Panel b: same as (a), but showing the PV diagram for the H30α radio-recombination line. The resolution is shown at the bottom right, representing the 20 mas beam major axis and a 1.3 km s−1 velocity resolution. Although tentative, there appears to be a very slight shift in position of the H30α emission in the same rotation sense as the disc. It is possible that this traces very hot rotating inner material inward of the molecule line emission in the disc. In both panels the black contours of the data are plotted at the 20–80% levels in steps of 10%. The axis scales and velocity range are different.
Current usage metrics show cumulative count of Article Views (full-text article views including HTML views, PDF and ePub downloads, according to the available data) and Abstracts Views on Vision4Press platform.
Data correspond to usage on the plateform after 2015. The current usage metrics is available 48-96 hours after online publication and is updated daily on week days.
Initial download of the metrics may take a while.