Fig. 3.
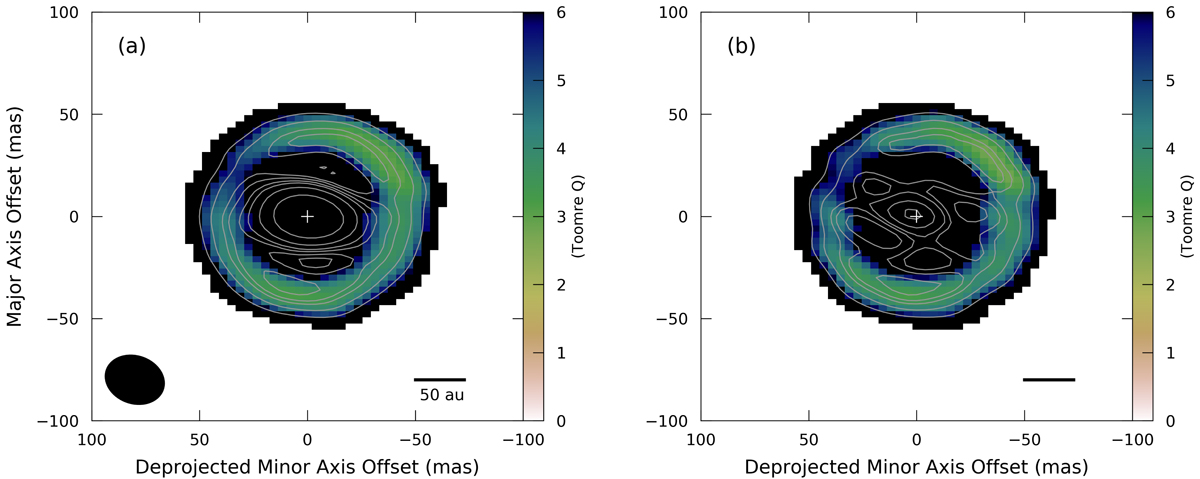
Panel a: Toomre Q map of G17.64 using the dust emission with the minimum free–free fraction subtracted for the mass surface density. Panel b: same as (a), but the maximum free–free contamination was removed before the mass surface density was calculated. The synthesised beam is indicated at the bottom left of the left figure and a scale to the right, while the grey contours are those shown in Figs. 1a and b. Values below the 10σ dust continuum emission level are masked out. The maps are centred (0,0) on G17.64 but are rotated by the PA (25.9°), aligning the disc major axis in the north-south direction. The disc is deprojected along the minor axis using the inclination of 40° in the image plane.
Current usage metrics show cumulative count of Article Views (full-text article views including HTML views, PDF and ePub downloads, according to the available data) and Abstracts Views on Vision4Press platform.
Data correspond to usage on the plateform after 2015. The current usage metrics is available 48-96 hours after online publication and is updated daily on week days.
Initial download of the metrics may take a while.