Fig. 2.
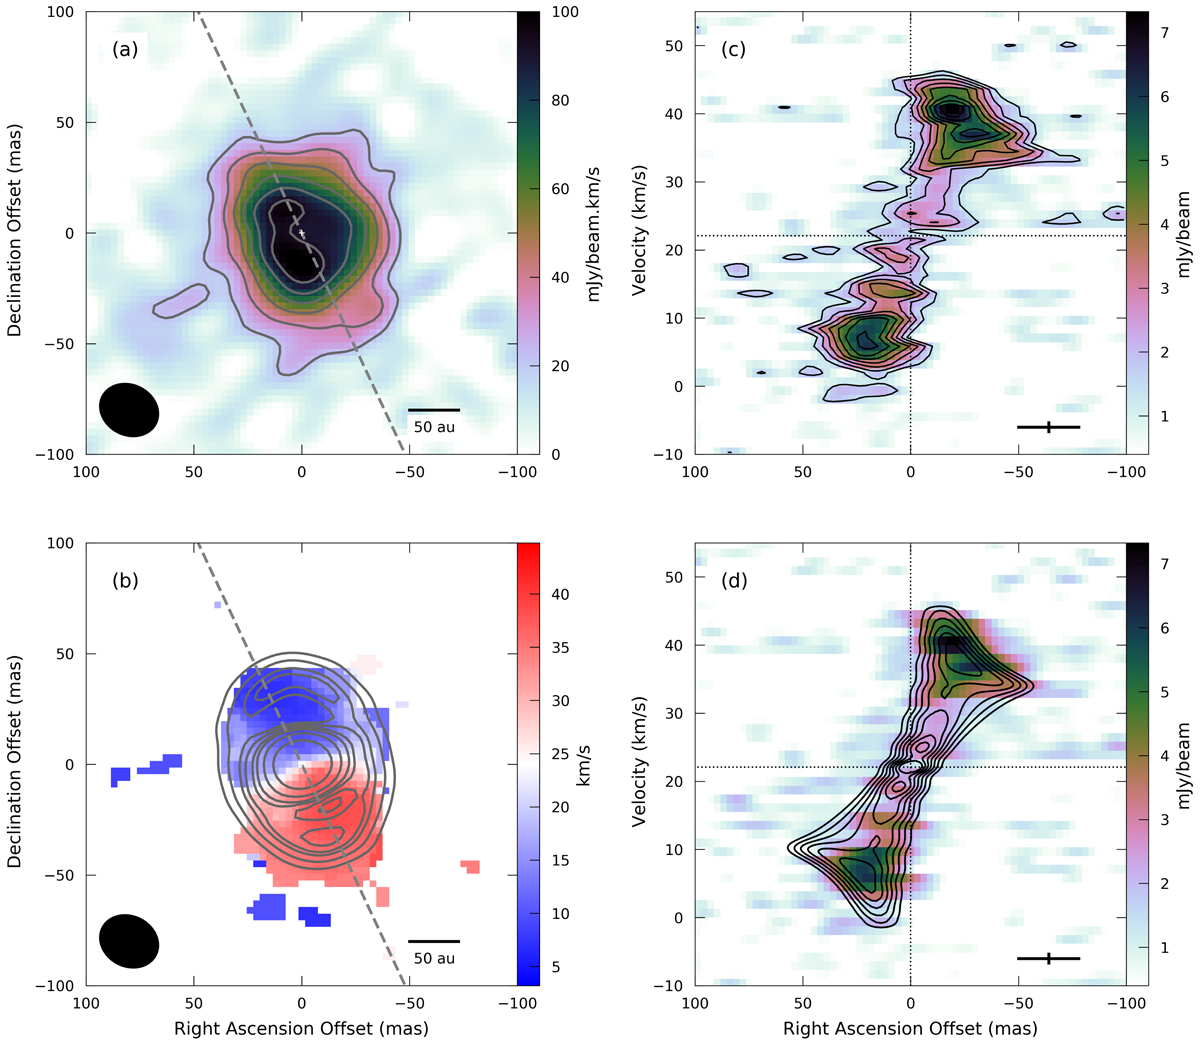
Panel a: integrated intensity (zero-moment) map of the H2O 55, 0−64, 3 ν2 = 1 (232.68670 GHz) molecular line emission. The contours trace emission at the 3, 5, 7, 9, and 11σ levels, where 1σ = 7.13 mJy beam−1 km s−1. Panel b: velocity-weighted integrated intensity (first-moment) map overlaid with the contours of the continuum emission from Fig.1a in grey. The outer extent of the H2O emission matches that of the dust continuum. Panel c: PV diagram for the H2O emission extracted from a 5 pixel wide slice along the dashed line at PA = 25.9° as indicated in (a) and (b). The contours of the data are plotted at the 20–80% levels in steps of 10%, where 10% corresponds to ∼1σ (0.65 mJy beam−1). Panel d: same as (c), but the contours indicate the best representative model using inner and outer disc radii of 30 and 120 au, respectively, a stellar mass of 45 M⊙, and a disc inclination angle of 40°. The spatial (28 mas) and velocity resolution (1.3 km s−1) are indicated by the black cross at the bottom right.
Current usage metrics show cumulative count of Article Views (full-text article views including HTML views, PDF and ePub downloads, according to the available data) and Abstracts Views on Vision4Press platform.
Data correspond to usage on the plateform after 2015. The current usage metrics is available 48-96 hours after online publication and is updated daily on week days.
Initial download of the metrics may take a while.