Fig. 1.
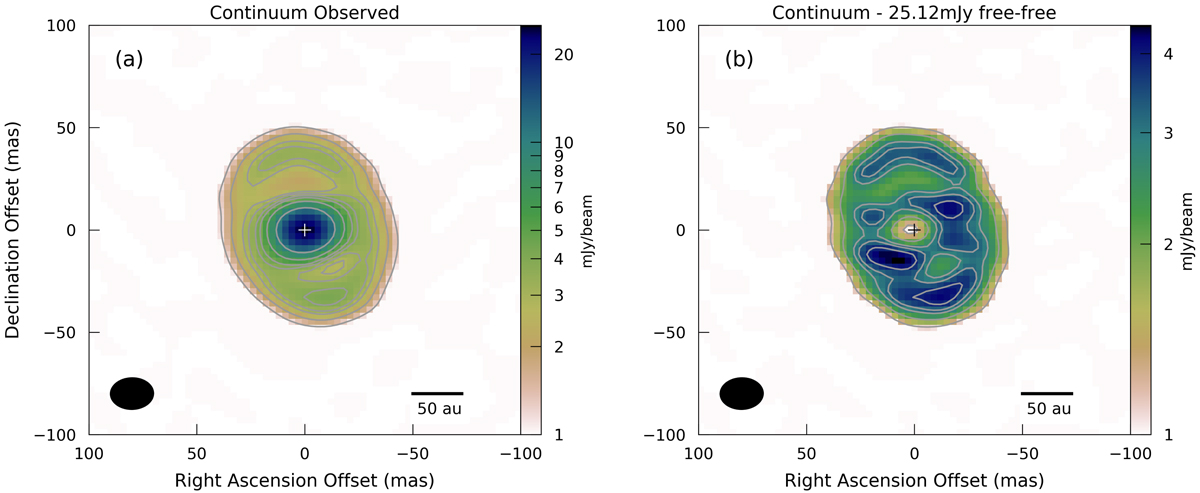
Panel a: ALMA band 6 (1.3 mm) long-baseline continuum image of G17.64 made at a resolution of 20 × 15 mas, PA −88.4°. The enhanced emission is clearest in the north and south between 65 and 97 au in the radial direction from G17.64. Panel b: same as (a), but with a point source of peak flux 25.12 mJy beam−1 removed from the visibilities, representing the strongest free–free contamination in G17.64. Additional substructures now become clear. Note the change in the scale of the colour bar. All contours are drawn at 30, 50, 70, 80, 95, 110, 150, and 250σ of the respective images, where 1σ = 40.4 μJy beam−1. The beam and scale bar are indicated at the bottom.
Current usage metrics show cumulative count of Article Views (full-text article views including HTML views, PDF and ePub downloads, according to the available data) and Abstracts Views on Vision4Press platform.
Data correspond to usage on the plateform after 2015. The current usage metrics is available 48-96 hours after online publication and is updated daily on week days.
Initial download of the metrics may take a while.