Fig. 1.
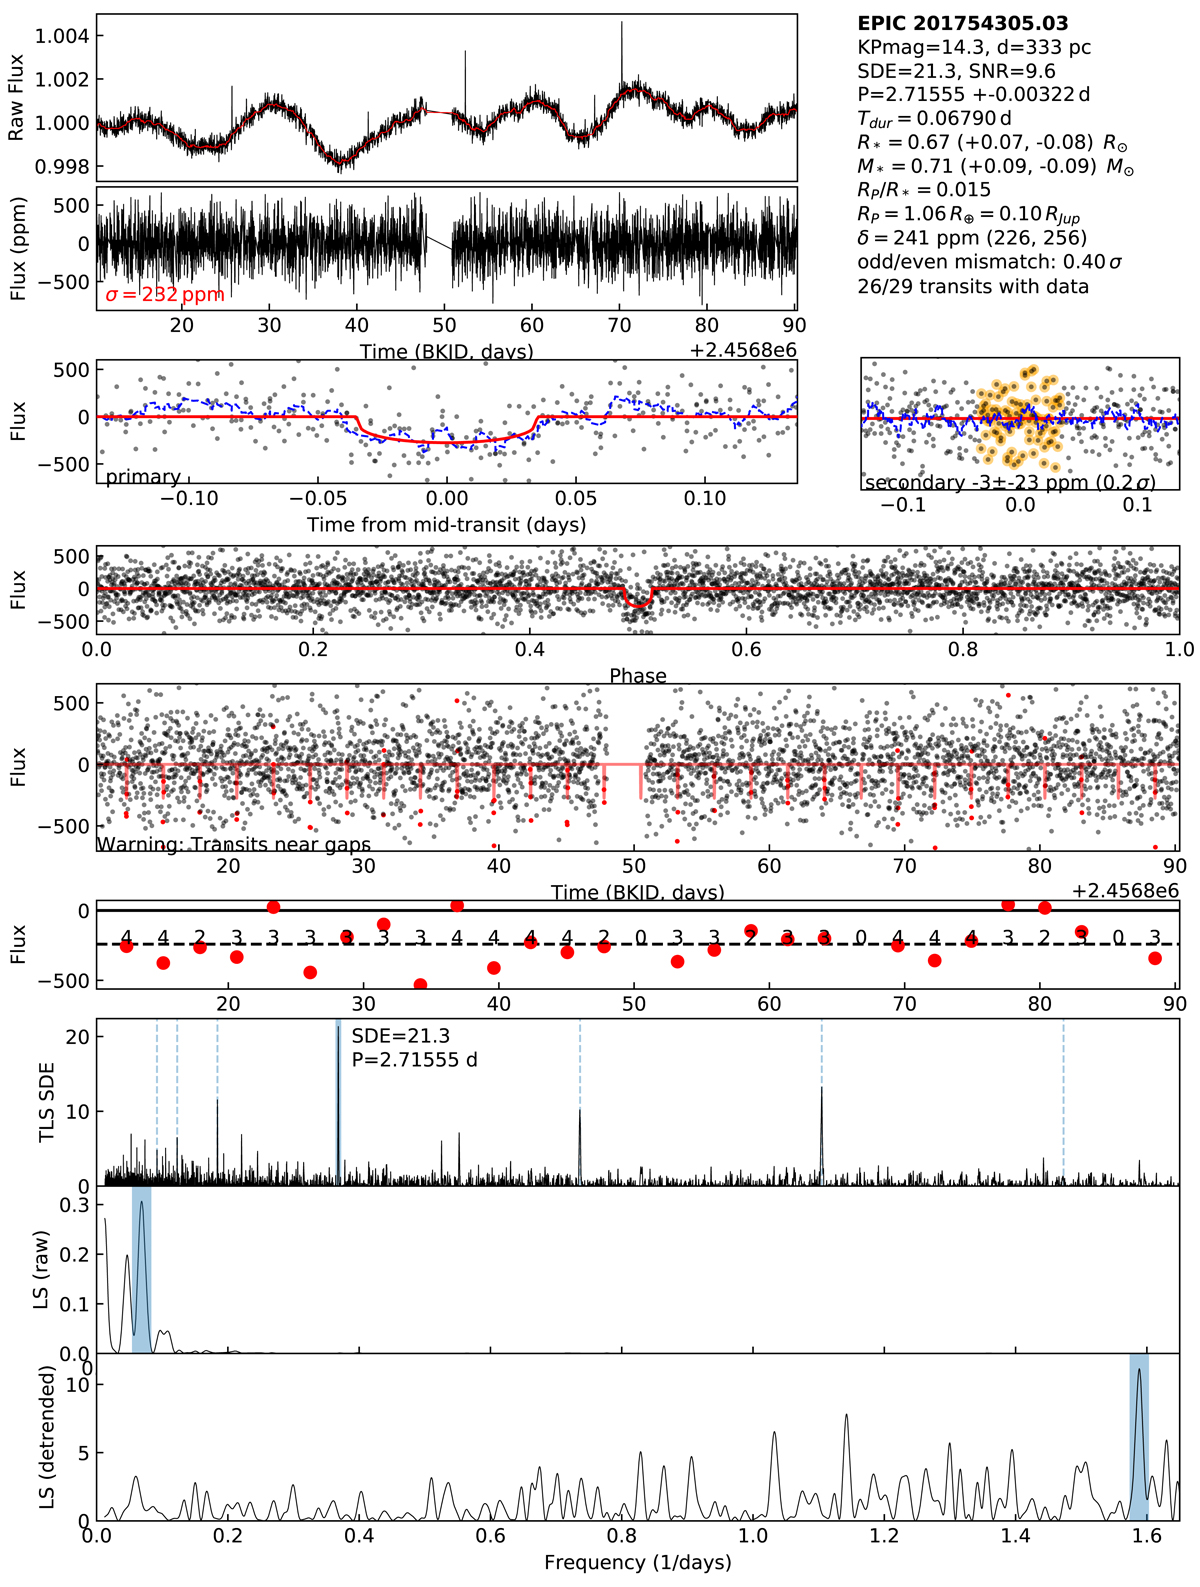
Example of a vetting sheet, here for 201754305.03. From top to bottom, the panels show the raw flux of the EVEREST light curve (with the running median in red), the normalized light curve, zooms into the transit candidate (left), and possible eclipse (right) times of the phase-folded light curve, the entire phase-folded light curve, the entire light curve with in-transit data of the new candidate marked in red, the sequence of transit depth measurements (including the number of in-transit points), the SDETLS periodogram, the Lomb-Scargle periodogram of the raw light curve, and the Lomb-Scargle periodogram of the detrended light curve. A summary of the basic system properties is shown in the upper right corner.
Current usage metrics show cumulative count of Article Views (full-text article views including HTML views, PDF and ePub downloads, according to the available data) and Abstracts Views on Vision4Press platform.
Data correspond to usage on the plateform after 2015. The current usage metrics is available 48-96 hours after online publication and is updated daily on week days.
Initial download of the metrics may take a while.