Free Access
Fig. 7.
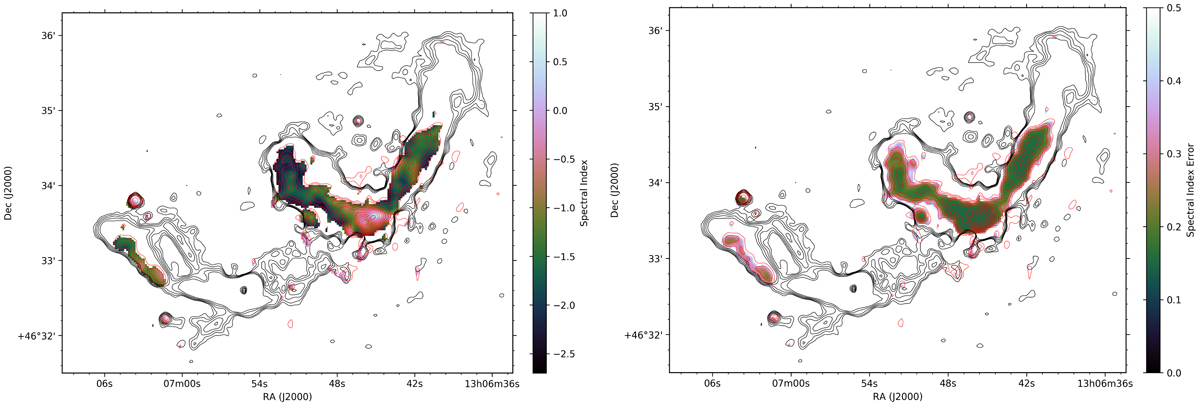
Left: spectral index map from our reprocessed GMRT data at 610 MHz to our LOFAR HBA data at 150 MHz. Both maps are at a resolution of 6″ × 6″. Contours start at five times the rms noise (90 μJy beam−1 for both LOFAR and GMRT), and increase by a factor of 1.7. Right: corresponding spectral index error map for each pixel.
Current usage metrics show cumulative count of Article Views (full-text article views including HTML views, PDF and ePub downloads, according to the available data) and Abstracts Views on Vision4Press platform.
Data correspond to usage on the plateform after 2015. The current usage metrics is available 48-96 hours after online publication and is updated daily on week days.
Initial download of the metrics may take a while.