Fig. 6.
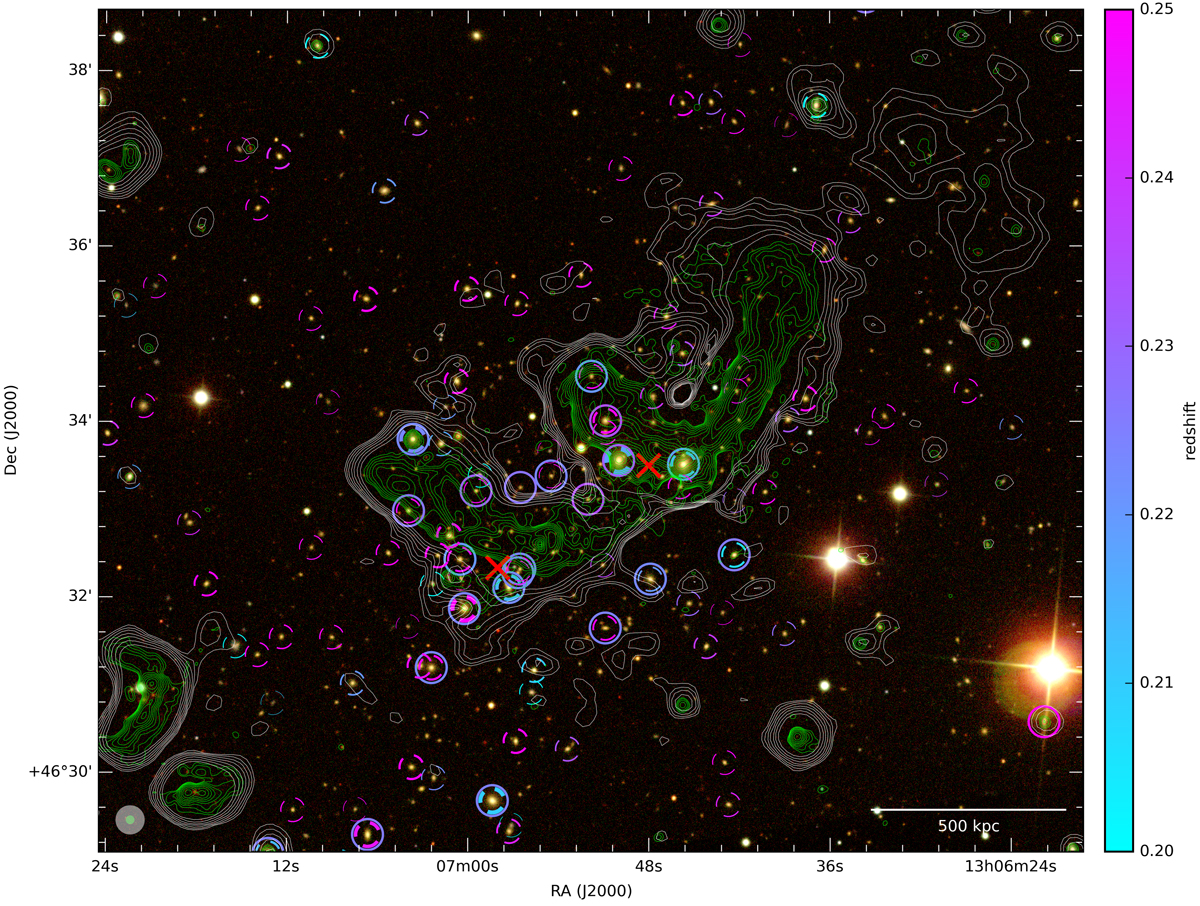
SDSS background composite image from bands g, r, and i. LOFAR contours at 20″ resolution are overlaid in white starting at five times the rms noise and increasing by a factor of 1.4. LOFAR contours at 6″ resolution are overlaid in green starting at five times the rms noise and increasing by a factor of 1.6. Redshift coloured markers are the same as in Fig. 1. Red crosses mark the centres of mass of the two sub-clusters identified by Dahle et al. (2002).
Current usage metrics show cumulative count of Article Views (full-text article views including HTML views, PDF and ePub downloads, according to the available data) and Abstracts Views on Vision4Press platform.
Data correspond to usage on the plateform after 2015. The current usage metrics is available 48-96 hours after online publication and is updated daily on week days.
Initial download of the metrics may take a while.