Free Access
Fig. 2.
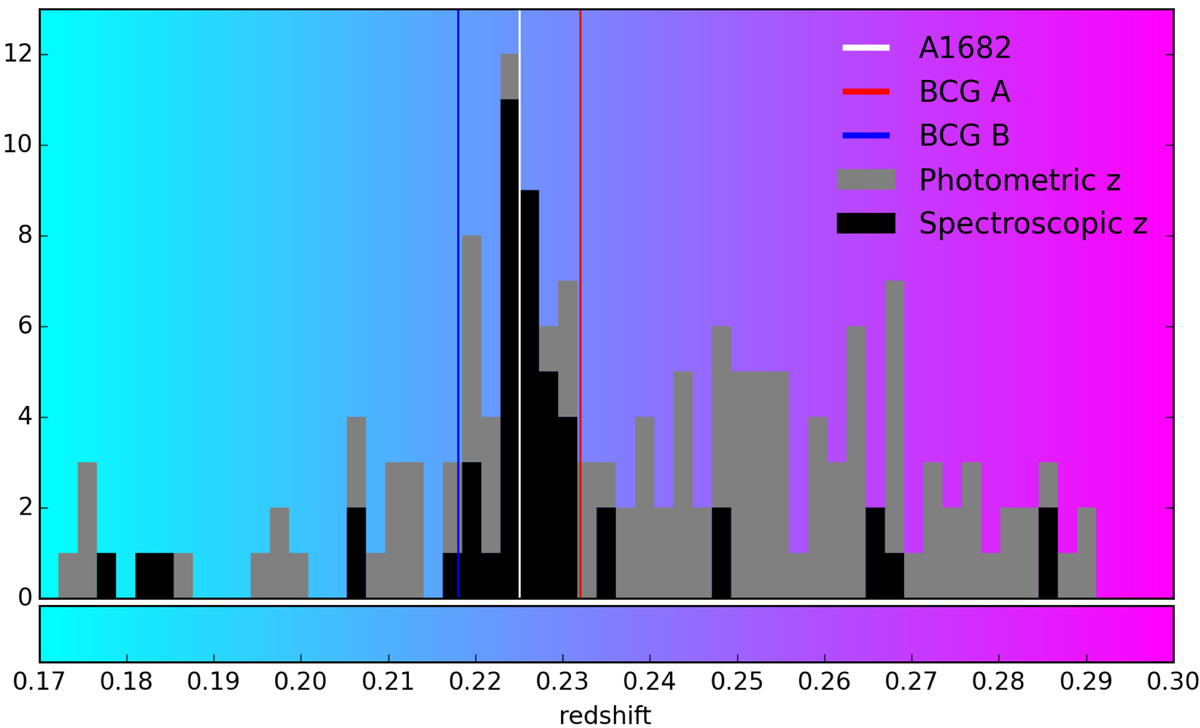
Stacked histogram of galaxies with photometric and spectroscopic redshifts within a 6′ radius around A1682. The redshift of A1682 is calculated as the average of BCG-A and BCG-B, which aligns well with the peak of the histogram.
Current usage metrics show cumulative count of Article Views (full-text article views including HTML views, PDF and ePub downloads, according to the available data) and Abstracts Views on Vision4Press platform.
Data correspond to usage on the plateform after 2015. The current usage metrics is available 48-96 hours after online publication and is updated daily on week days.
Initial download of the metrics may take a while.