Fig. 1.
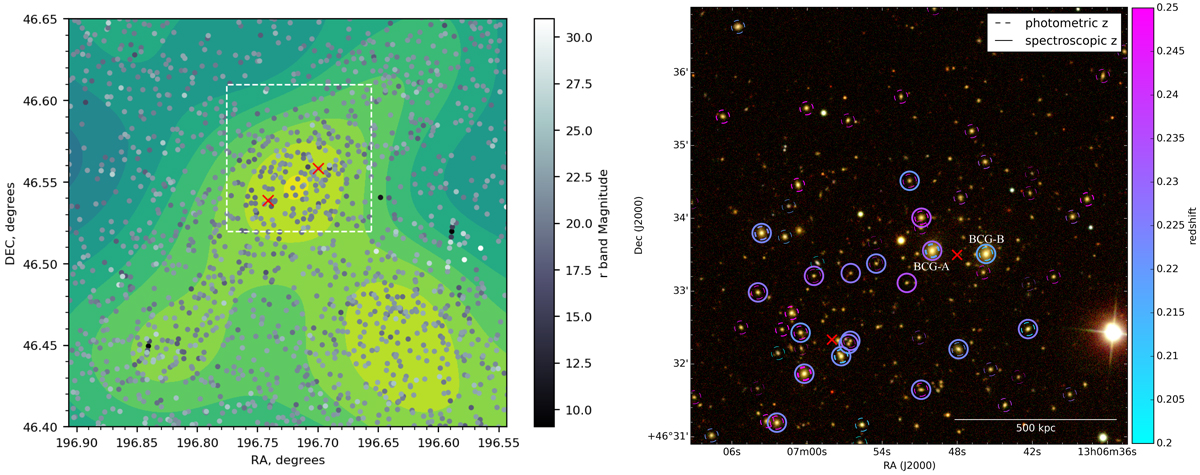
Left: dots showing all galaxies identified in the region from SDSS, with the corresponding galaxy density shown by filled contours. Red crosses denote the centre of mass of the sub-clusters identified by Dahle et al. (2002). Right: SDSS composite image from bands g, r, i within the area shown by the white square in the left plot. The two brightest galaxies are labelled, where BCG-A (13:06:49.99, +46:33:33.35) has a redshift of 0.232, and and BCG-B (13:06:45.69, +46:33:30.74) has a redshift of 0.218. The width of the dashed circles around galaxies with photometric redshifts is proportional to the error on the measurement, where they start at 4% and get thinner as the error increases. The maximum photometric error is 50%.
Current usage metrics show cumulative count of Article Views (full-text article views including HTML views, PDF and ePub downloads, according to the available data) and Abstracts Views on Vision4Press platform.
Data correspond to usage on the plateform after 2015. The current usage metrics is available 48-96 hours after online publication and is updated daily on week days.
Initial download of the metrics may take a while.